
Home Sales Fall (Again). What’s Next?
By Mueller Financial Services, August 22, 2022
Existing home sales fell 5.9% in July, the sixth consecutive month of declines as higher interest rates weigh on housing affordability and prospective buyers. As the housing market slowed, so did prices. The median price for a single family home was $410,600, a decline of roughly $10,000 from June. However, homes do not stay on the market long. Over the last two months, homes were on the market for an average of only 14 days, three days shorter than a year ago.
Existing home sales plummet but inventory stays low
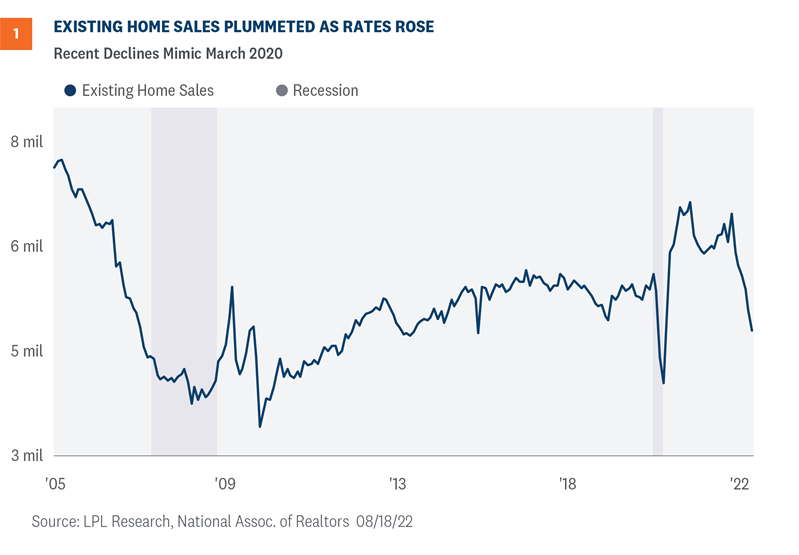
Existing home sales fell 5.9% in July, the largest one month decline since February and the sixth straight contraction. Contract closings fell to an annualized 4.81 million, the lowest level since May 2020 [Figure 1]. Outside of the onset of the pandemic, July levels were the lowest since late 2015 when the real estate market was recovering from the Great Financial Crisis.
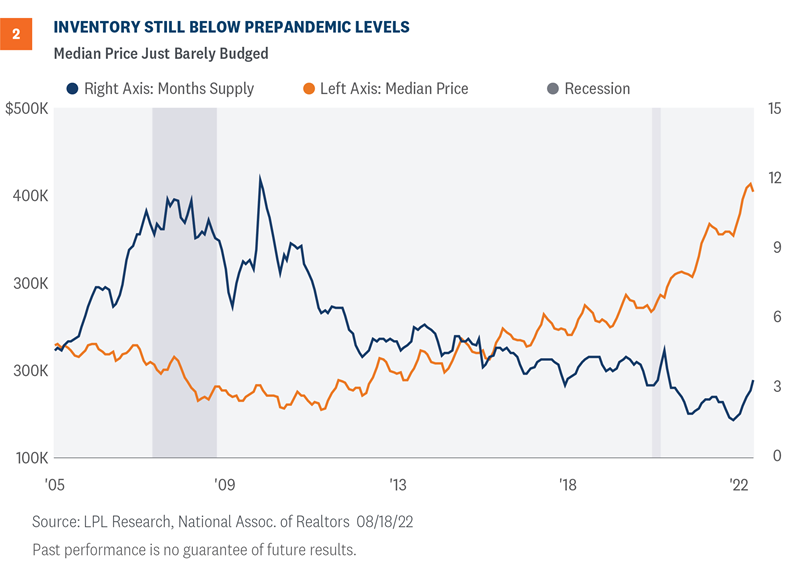
Although the rate of sales is slowing dramatically, the market is still short on supply of homes. At the current sales rate, it would take roughly three months to clear inventory [Figure 2]. As supply remains tight, homes are selling quickly and still at elevated prices. In July, the average existing home for sale was on the market for only 14 days, three days shorter than a year ago.
Traffic of prospective buyers fell
Forward-looking indicators suggest that the housing slowdown has more to go. The National Association of Home Builders (NAHB) index, another important housing metric, fell in August to below 50 for the first time since May 2020. Traffic of prospective buyers, a leading indicator of future sales, also fell to its lowest since May 2020. At this rate, home sales will likely continue to slow and residential investment could turn out to be a drag on Q3 economic growth. Given the lag between Federal Reserve (Fed) policy and the real economy, we have not likely seen the bottom in the housing market.
Regional differences are profound
Regional variations abound in both the soft survey data of the NAHB index and in the hard data of existing home sales. For NAHB, the regional divergence widened in August. The South is the only region above the breakeven level of 50 as households pursue areas with lower costs of living. Sustained inflation makes consumers increasingly sensitive to high prices and more likely to move to regions with lower costs of living if they can conserve disposable income.
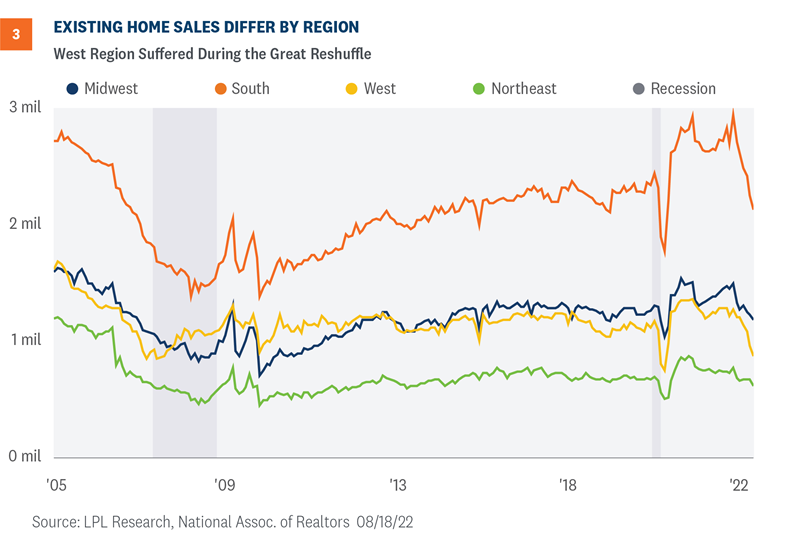
Sales of existing home in the West were hit hard in July. Outside of the pandemic, the rate of sales were close to sales rates in 2007 and 2008, when the economy was in the depths of a housing crisis [Figure 3]. In this current case, the problem is not in credit markets but in the great reshuffling of households as the hybrid work environment takes hold and workers are looking for more square footage for home offices.
Conclusion
The domestic economy will likely experience more declines in housing, yet this environment is very different from the Great Financial Crisis. The banking sector is better capitalized, we do not see a “Lehman moment” lurking, and homeowners are generally not under water with loan-to-value metrics. The potential risks are the Fed overtightens, consumer incomes fall as the job market weakens, and inflation does not cool as much as the market expects. A slowing housing market could also impact consumer spending through secondary wealth effects.
Jeffrey Roach, PhD, Chief Economist, LPL Financial
Marc Zabicki, CFA, Chief Investment Officer and Director of Research, LPL Financial
_________________________________________________________________________
IMPORTANT DISCLOSURES
This material is for general information only and is not intended to provide specific advice or recommendations for any individual. There is no assurance that the views or strategies discussed are suitable for all investors or will yield positive outcomes. Investing involves risks including possible loss of principal. Any economic forecasts set forth may not develop as predicted and are subject to change.
References to markets, asset classes, and sectors are generally regarding the corresponding market index. Indexes are unmanaged statistical composites and cannot be invested into directly. Index performance is not indicative of the performance of any investment and does not reflect fees, expenses, or sales charges. All performance referenced is historical and is no guarantee of future results.
Any company names noted herein are for educational purposes only and not an indication of trading intent or a solicitation of their products or services. LPL Financial doesn’t provide research on individual equities.
All information is believed to be from reliable sources; however, LPL Financial makes no representation as to its completeness or accuracy.
The Consumer Price Index (CPI) is a measure of the average change over time in the prices paid by urban consumers for a market basket of consumer goods and services.
All index data from FactSet.
Personal consumption expenditures (PCE) is a measure of price changes in consumer goods and services released monthly by the Bureau of Economic Analysis (BEA). Personal consumption expenditures consist of the actual and imputed expenditures of households; the measure includes data pertaining to durables, nondurables, and services. It is essentially a measure of goods and services targeted toward individuals and consumed by individuals.
This research material has been prepared by LPL Financial LLC.
Securities and advisory services offered through LPL Financial (LPL), a registered investment advisor and broker -dealer (member FINRA/SIPC). Insurance products are offered through LPL or its licensed affiliates. To the extent you are receiving investment advice from a separately registered independent investment advisor that is not an LPL affiliate, please note LPL makes no representation with respect to such entity.
Not Insured by FDIC/NCUA or Any Other Government Agency | Not Bank/Credit Union Guaranteed | Not Bank/Credit Union Deposits or Obligations | May Lose Value |
RES-1244950-0822 | For Public Use | Tracking # 1-05317808 (Exp. 08/23)
Real EstateRelated Insights

November 4, 2024
Election Stock Market Playbook
SharePrinter Friendly Version As Election Day approaches, we discuss potential stock market implications of various possible outcomes. But before we …
Read More navigate_next
October 28, 2024
What Scares Us About the Economy and Markets
SharePrinter Friendly Version Stocks have done so well this year that it’s fair to say market participants haven’t feared much. …
Read More navigate_next