
Sell in May: Does This Stock Market Adage Come into Play
By Mueller Financial Services, May 1, 2023
“Sell in May and go away” is probably the most widely cited stock market cliché in history. Every year a barrage of Wall Street commentaries and stories in the financial press floods in about this popular, but overused, stock market adage. Here we take our annual look at this historical seasonal pattern which, as you will see below, has started to lose some of its street cred recently.
What is sell in may?
“Sell in May and go away” is the seasonal stock market pattern in which stocks generally produce the best returns from November through April and the worst returns from May through October. This pattern has been strong enough—and the adage popular enough—that it has probably been somewhat of a self-fulfilling prophecy over many years. Some investors do think it’s best to either avoid or reduce equities during this period. We’re not so sure.
The two figures below illustrate this pattern. Figure 1 shows average returns by calendar month (data back to 1950). Here you can see stocks tend not to do as well during middle months, on average, particularly May through September.
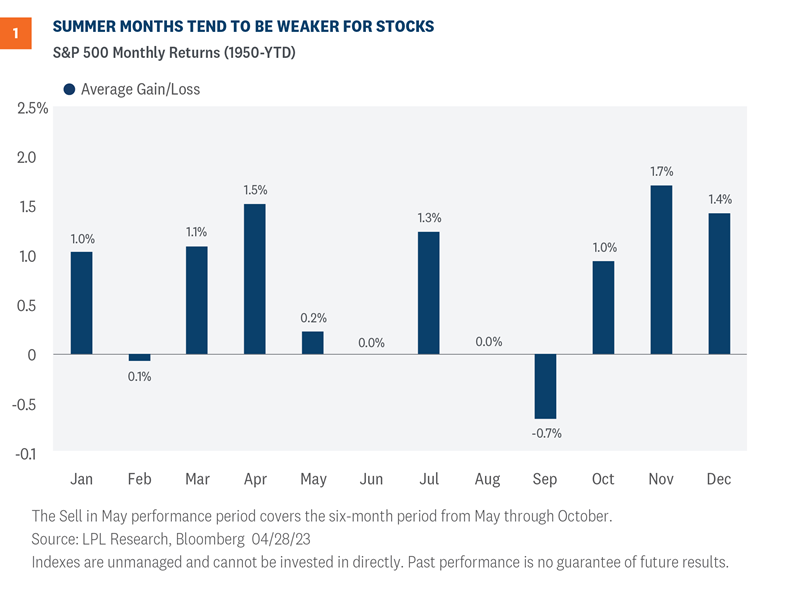
Figure 2 illustrates rolling six-month returns for each of the 12 rolling six-month periods by month (again, data back to 1950). Here you see the weakest six-month period for stocks historically, on average, has been May through October (1.7%), while the best six-month period has come between November and April (6.9%).
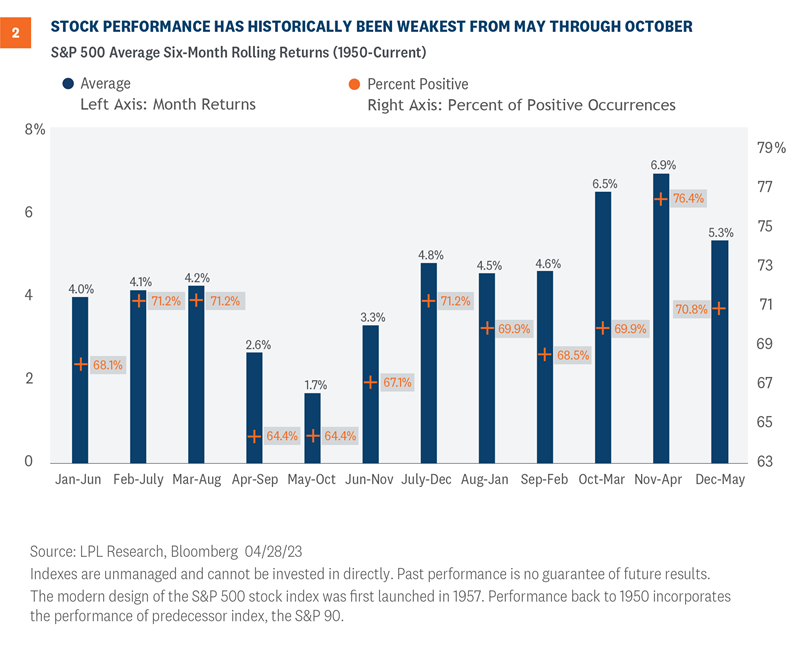
Interestingly, the S&P 500 was up 7.6% over the past six months (November through April), roughly in line with the historical average. That may suggest a typical gain for the next six months might be in order. That’s not great, but it’s not terrible. We think we can make a good case for upside beyond that 1.7% between now and Halloween. And that would still leave the seasonally strong November and December months for the S&P 500 Index to reach our year-end fair value target range of 4,300–4,400.
In recent years, buy in may has worked better
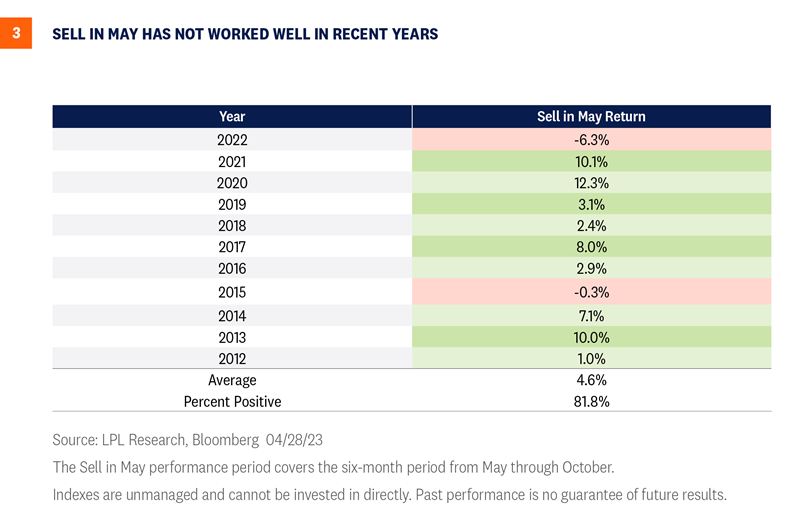
We should also keep in mind, as we head into this seasonally weak period, that the S&P 500 has closed higher during the month of May nine out of the past 10 years—so maybe the pattern should be “Sell in June.” Also, consider that this seasonally weak period has actually been quite strong in recent years. In fact, stocks gained during this seasonally weak six-month period in nine of the past 11 years, as you can see Figure 3.
So what about this year?
Our year-end fair value target for the S&P 500 implies about 4% upside over the balance of 2023, That target is based on a price-to-earnings ratio (P/E) of 18 and our 2024 earnings forecast of $240 (though that estimate is under review, and the Strategic and Tactical Asset Allocation Committee’s (STAAC) bias is to potentially bring that estimate down some). The “right answer” to potentially get us there may actually be a higher P/E and lower earnings, though we’ve been encouraged by first quarter earnings results thus far (more on that topic here in the coming weeks).
Assuming stocks generate another 4–5% upside between now and year end, the question is when do those gains come? Gains late in the year would make sense because of this seasonal pattern and opportunities to: 1) gain more clarity on the path of the economy and 2) make progress bringing inflation down to help get the Federal Reserve (Fed) off the market’s back.
On the other hand, market sentiment and traders’ positioning are pessimistic enough that maybe just bringing the Fed’s rate hiking campaign to an end this spring, getting past the debt limit increase, and seeing earnings avoid a collapse (which we’re clearly seeing during the current earnings season) could be enough to push this market higher. Finally, if the “Sell in May” pattern hasn’t worked well in recent years, maybe it won’t in 2023.
Our guess is more gains come later in the year, and that we see a 5–10% pullback between now and Halloween as is typical (we get three of those a year, on average), but that is not a high conviction prediction.
Investment outlook
As stocks enter a seasonally weak period with near-term macro risks ahead, investors may not want to stray too far from their benchmark exposures to equities. Stocks are getting more support from earnings than we had anticipated, but earnings declines aren’t over. While the May rate hike from the Fed may be its last of this cycle—we’ll learn more about that when we hear from Fed Chair Jerome Powell and company on Wednesday—clearly the inflation problem hasn’t yet been solved.
Bottom line, LPL Research remains comfortable with its year-end S&P 500 fair value target of 4,300–4,400. But as stocks get closer to that target, LPL Research’s Strategic and Tactical Asset Allocation Committee (STAAC) may reconsider its recommended slight overweight allocation to equities. The Committee notes that the outlook for growth stocks has improved, suggesting balanced style exposure, while the outlook for small caps has gotten more challenging in recent weeks, as credit conditions have tightened amid ongoing small bank stress. The industrials sector remains the Committee’s top pick.
Within fixed income, the Committee recommends an up-in-quality approach with a benchmark weight to duration. We think core bond sectors (U.S. Treasuries, Agency mortgage-backed securities, (MBS) and short-maturity investment grade corporates) are currently more attractive than plus sectors (high-yield bonds and non-U.S. sectors) with the exception of preferred securities, which look attractive after having recently sold off due to the banking stresses.
Jeffrey Buchbinder, CFA, Chief Equity Strategist
Adam Turnquist, CMT, Chief Technical Strategist
You may also be interested in:
- Draining the Lifeblood of the Economy: The Small Business Sector – April 24, 2023
- A Closer Look at Commercial Real Estate Market – April 17, 2023
- Earnings Preview – Malaise Continues – April 10, 2023
IMPORTANT DISCLOSURES
This material is for general information only and is not intended to provide specific advice or recommendations for any individual. There is no assurance that the views or strategies discussed are suitable for all investors or will yield positive outcomes. Investing involves risks including possible loss of principal. Any economic forecasts set forth may not develop as predicted and are subject to change.
References to markets, asset classes, and sectors are generally regarding the corresponding market index. Indexes are unmanaged statistical composites and cannot be invested into directly. Index performance is not indicative of the performance of any investment and do not reflect fees, expenses, or sales charges. All performance referenced is historical and is no guarantee of future results.
Any company names noted herein are for educational purposes only and not an indication of trading intent or a solicitation of their products or services. LPL Financial doesn’t provide research on individual equities.
All information is believed to be from reliable sources; however, LPL Financial makes no representation as to its completeness or accuracy.
All investing involves risk, including possible loss of principal.
US Treasuries may be considered “safe haven” investments but do carry some degree of risk including interest rate, credit, and market risk. Bonds are subject to market and interest rate risk if sold prior to maturity. Bond values will decline as interest rates rise and bonds are subject to availability and change in price.
The Standard & Poor’s 500 Index (S&P500) is a capitalization-weighted index of 500 stocks designed to measure performance of the broad domestic economy through changes in the aggregate market value of 500 stocks representing all major industries.
The PE ratio (price-to-earnings ratio) is a measure of the price paid for a share relative to the annual net income or profit earned by the firm per share. It is a financial ratio used for valuation: a higher PE ratio means that investors are paying more for each unit of net income, so the stock is more expensive compared to one with lower PE ratio.
Earnings per share (EPS) is the portion of a company’s profit allocated to each outstanding share of common stock. EPS serves as an indicator of a company’s profitability. Earnings per share is generally considered to be the single most important variable in determining a share’s price. It is also a major component used to calculate the price-to-earnings valuation ratio.
All index data from Bloomberg.
For a list of descriptions of the indexes and economic terms referenced in this publication, please visit our website at lplresearch.com/definitions.
This research material has been prepared by LPL Financial LLC.
Securities and advisory services offered through LPL Financial (LPL), a registered investment advisor and broker -dealer (member FINRA/SIPC). Insurance products are offered through LPL or its licensed affiliates. To the extent you are receiving investment advice from a separately registered independent investment advisor that is not an LPL affiliate, please note LPL makes no representation with respect to such entity.
Not Insured by FDIC/NCUA or Any Other Government Agency | Not Bank/Credit Union Guaranteed | Not Bank/Credit Union Deposits or Obligations | May Lose Value |
RES-1513785-0423 | For Public Use | Tracking #1-05369022 (Exp. 05/24)
Related Insights

November 4, 2024
Election Stock Market Playbook
SharePrinter Friendly Version As Election Day approaches, we discuss potential stock market implications of various possible outcomes. But before we …
Read More navigate_next
October 28, 2024
What Scares Us About the Economy and Markets
SharePrinter Friendly Version Stocks have done so well this year that it’s fair to say market participants haven’t feared much. …
Read More navigate_next