
Sell in May? Maybe Not. More Rhyme Than Reason
By Mueller Financial Services, May 6, 2024
“Sell in May and Go Away” is one of the most widely used maxims on Wall Street. There is no shortage of financial media coverage on this topic as the calendar turns to May. However, this phrase may be more rhyme than reason, as stocks tend to trade higher during this period (especially more recently), subject to potentially elevated volatility. Of course, seasonality is one factor that could influence markets, but the economy and monetary policy are much bigger factors. With the Federal Reserve (Fed) pointing to higher-for-longer monetary policy last week (before Friday’s softer jobs report), we also explore how stocks perform during prolonged Fed pause periods.
Origins
The “Sell in May and Go Away” maxim originated in London under a slightly modified phrase: “Sell in May and go away, come back on St. Leger’s Day.” The St. Leger is a famous fall horse race in the U.K. that dates back to 1776. The premise behind the saying is that investors should sell their equity positions in May, enjoy the summer months and avoid seasonal market weakness, and then come back to the market when seasonality trends become more constructive in November.
Why is the phrase so popular? Math and marketing may have something to do with it — areas Wall Street is pretty good at. Other than an easy adage to remember, the May through October time frame has been the worst six-month return window for the S&P 500 since 1950, as opposed to the best-performing six-month return window from November through April. This historical seasonal pattern has been consistent enough — and the phrase popular enough — that it may have become a self-fulfilling prophecy over many years.
While the U.S. might not have the St. Leger race, we did celebrate the Kentucky Derby over the weekend, and the thought of “enjoying” some golf and beach time this summer sounds appealing, but we don’t wholly subscribe to going away from the market over the next six months.
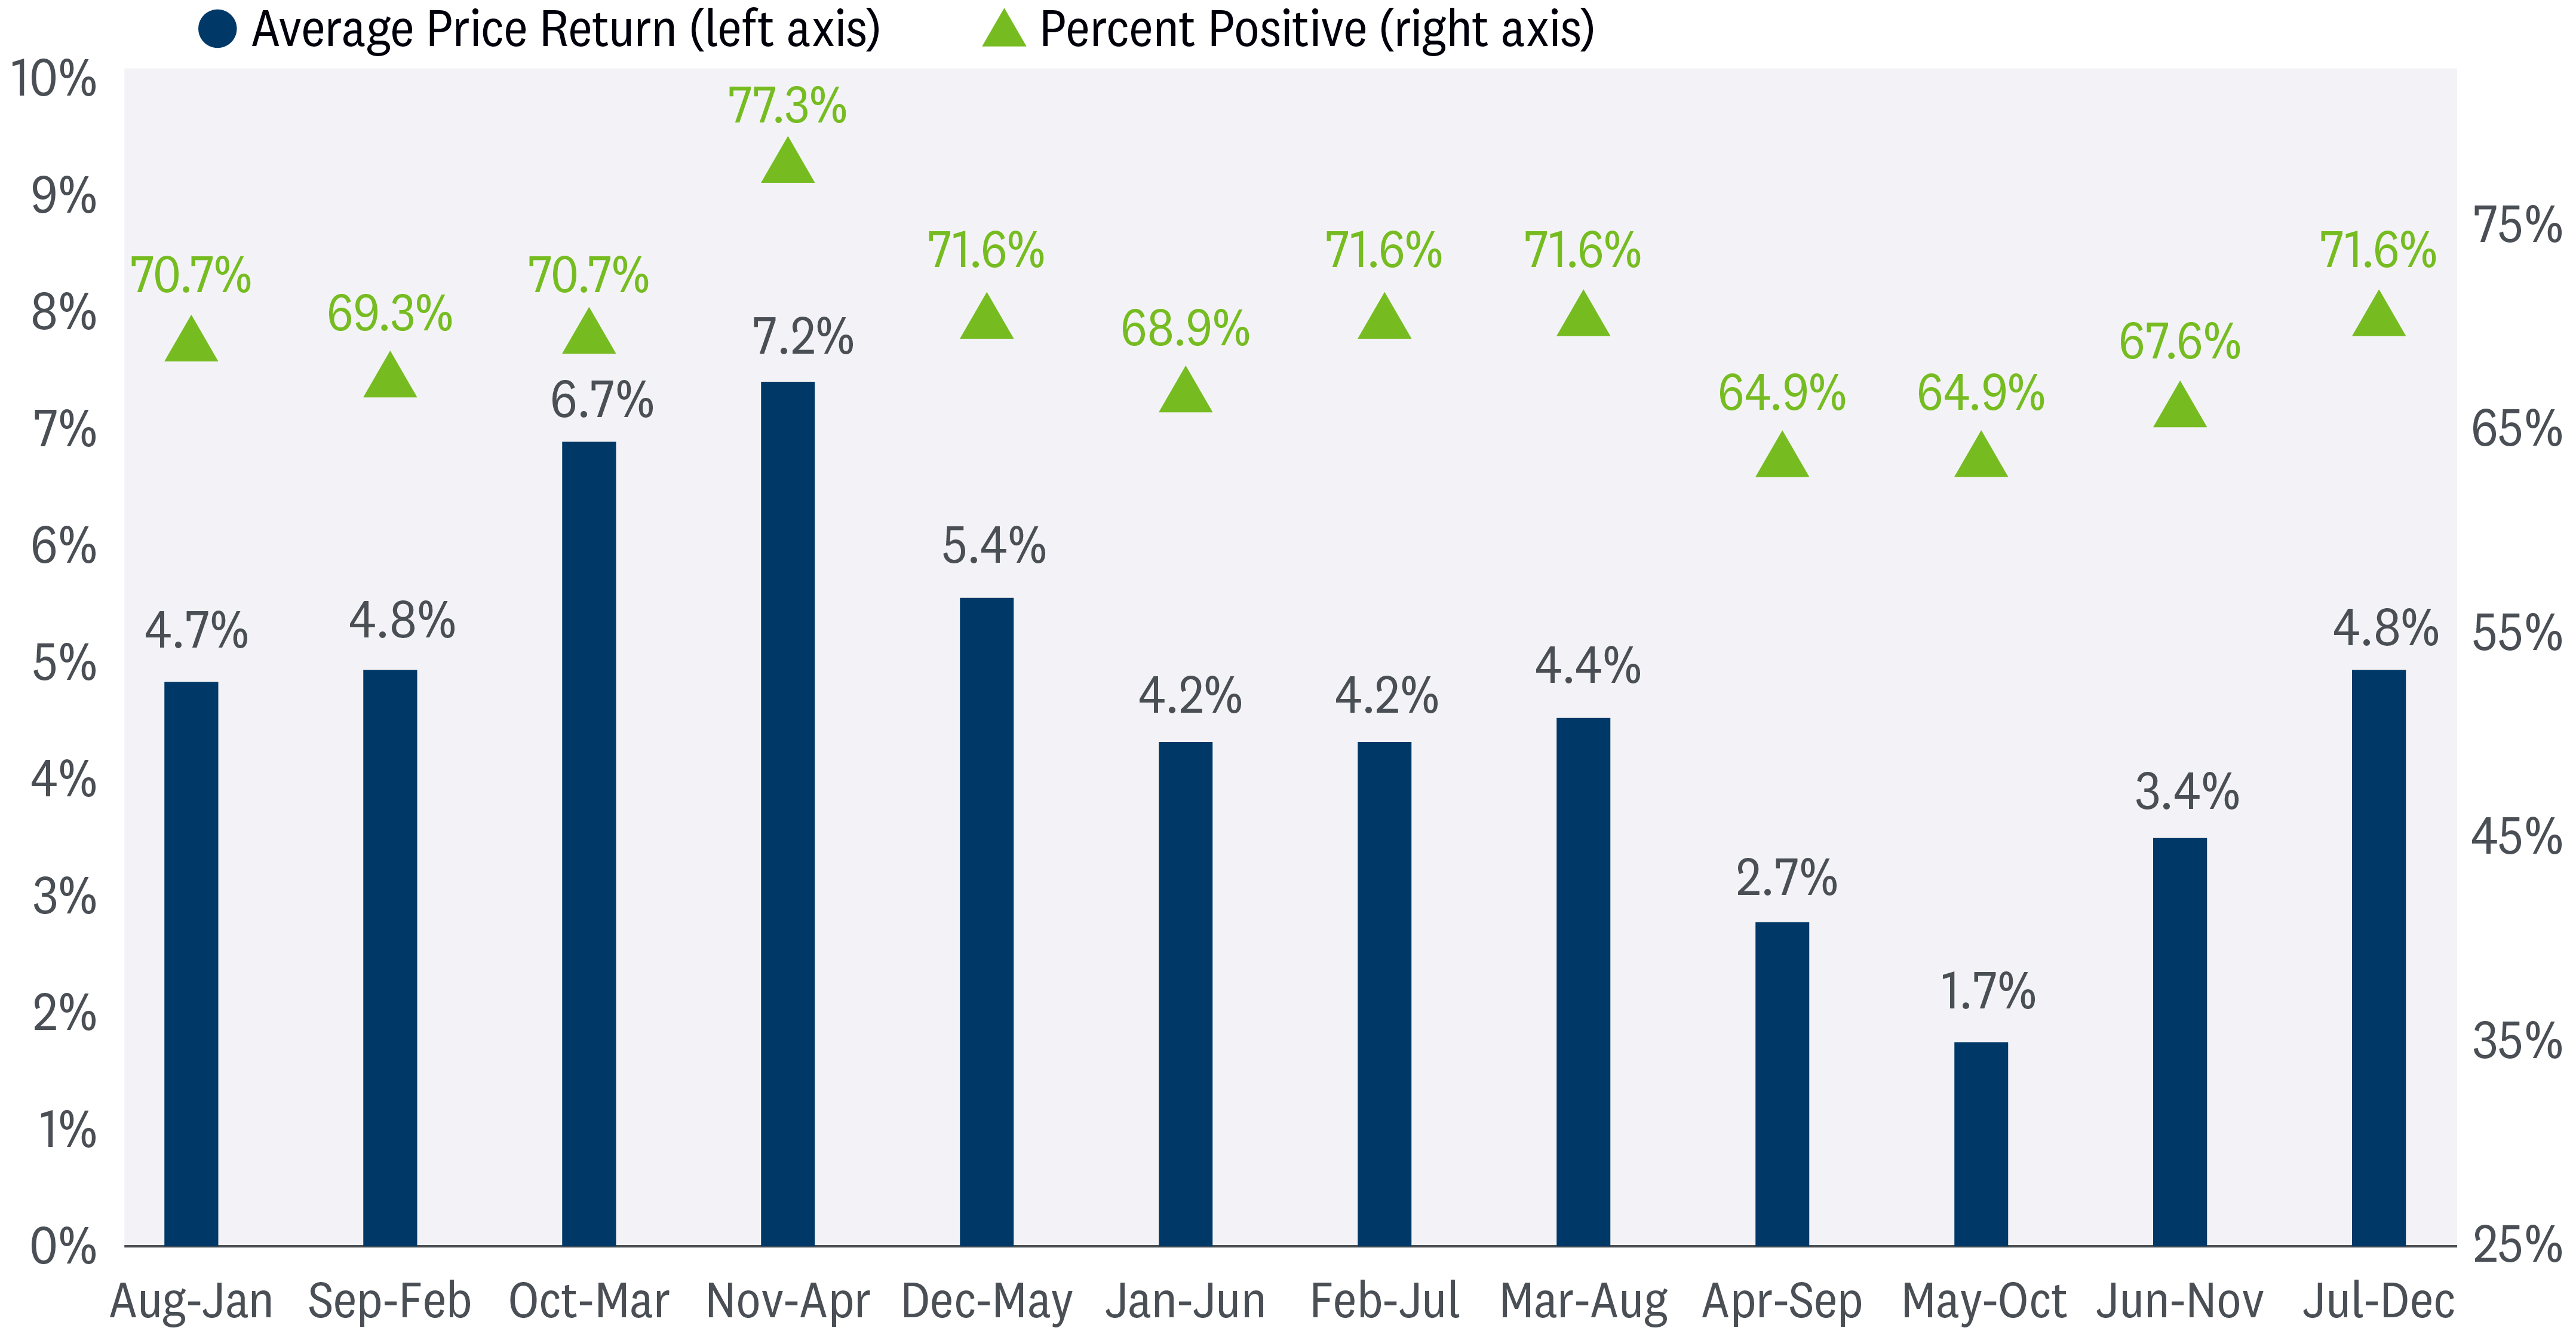
The table below highlights rolling six-month price returns for the S&P 500 across all 12-month periods since 1950. And while the May through October time frame has historically underwhelmed with an average gain of only 1.7%, returns importantly have been positive 65% of the time. Of course, that doesn’t stack up very well compared to the 7.2% average gain between November and April, but other technical and fundamental factors point to upside potential beyond the average 1.7% gain during this year’s “Sell in May” period. Longer-term momentum indicators point to more potential upside for stocks before year-end, earnings continue to surprise to the upside with estimates holding steady (estimates typically fall 2–3%), while economic activity is humming along at a solid pace. Furthermore, Friday’s goldilocks jobs report showed labor demand slowing but still growing and cooling wage growth, helping raise the probabilities for two rate cuts by year-end.
May to October Returns Aren’t Great — But They Tend to be Positive
Past performance is no guarantee of future results. All indexes are unmanaged and can’t be invested in directly. The modern design of the S&P 500 stock index was first launched in 1957. Performance back to 1950 incorporates the performance of the predecessor index, the S&P 90.
Recent Years Have Yielded Better Returns
More recently, the month of May and the “Sell in May” time frame have yielded better results. Over the last 10 years, monthly returns in May have averaged 0.7%, with nine of the last 10 years producing positive monthly returns. This compares to the longer-term average May return of only 0.2%.
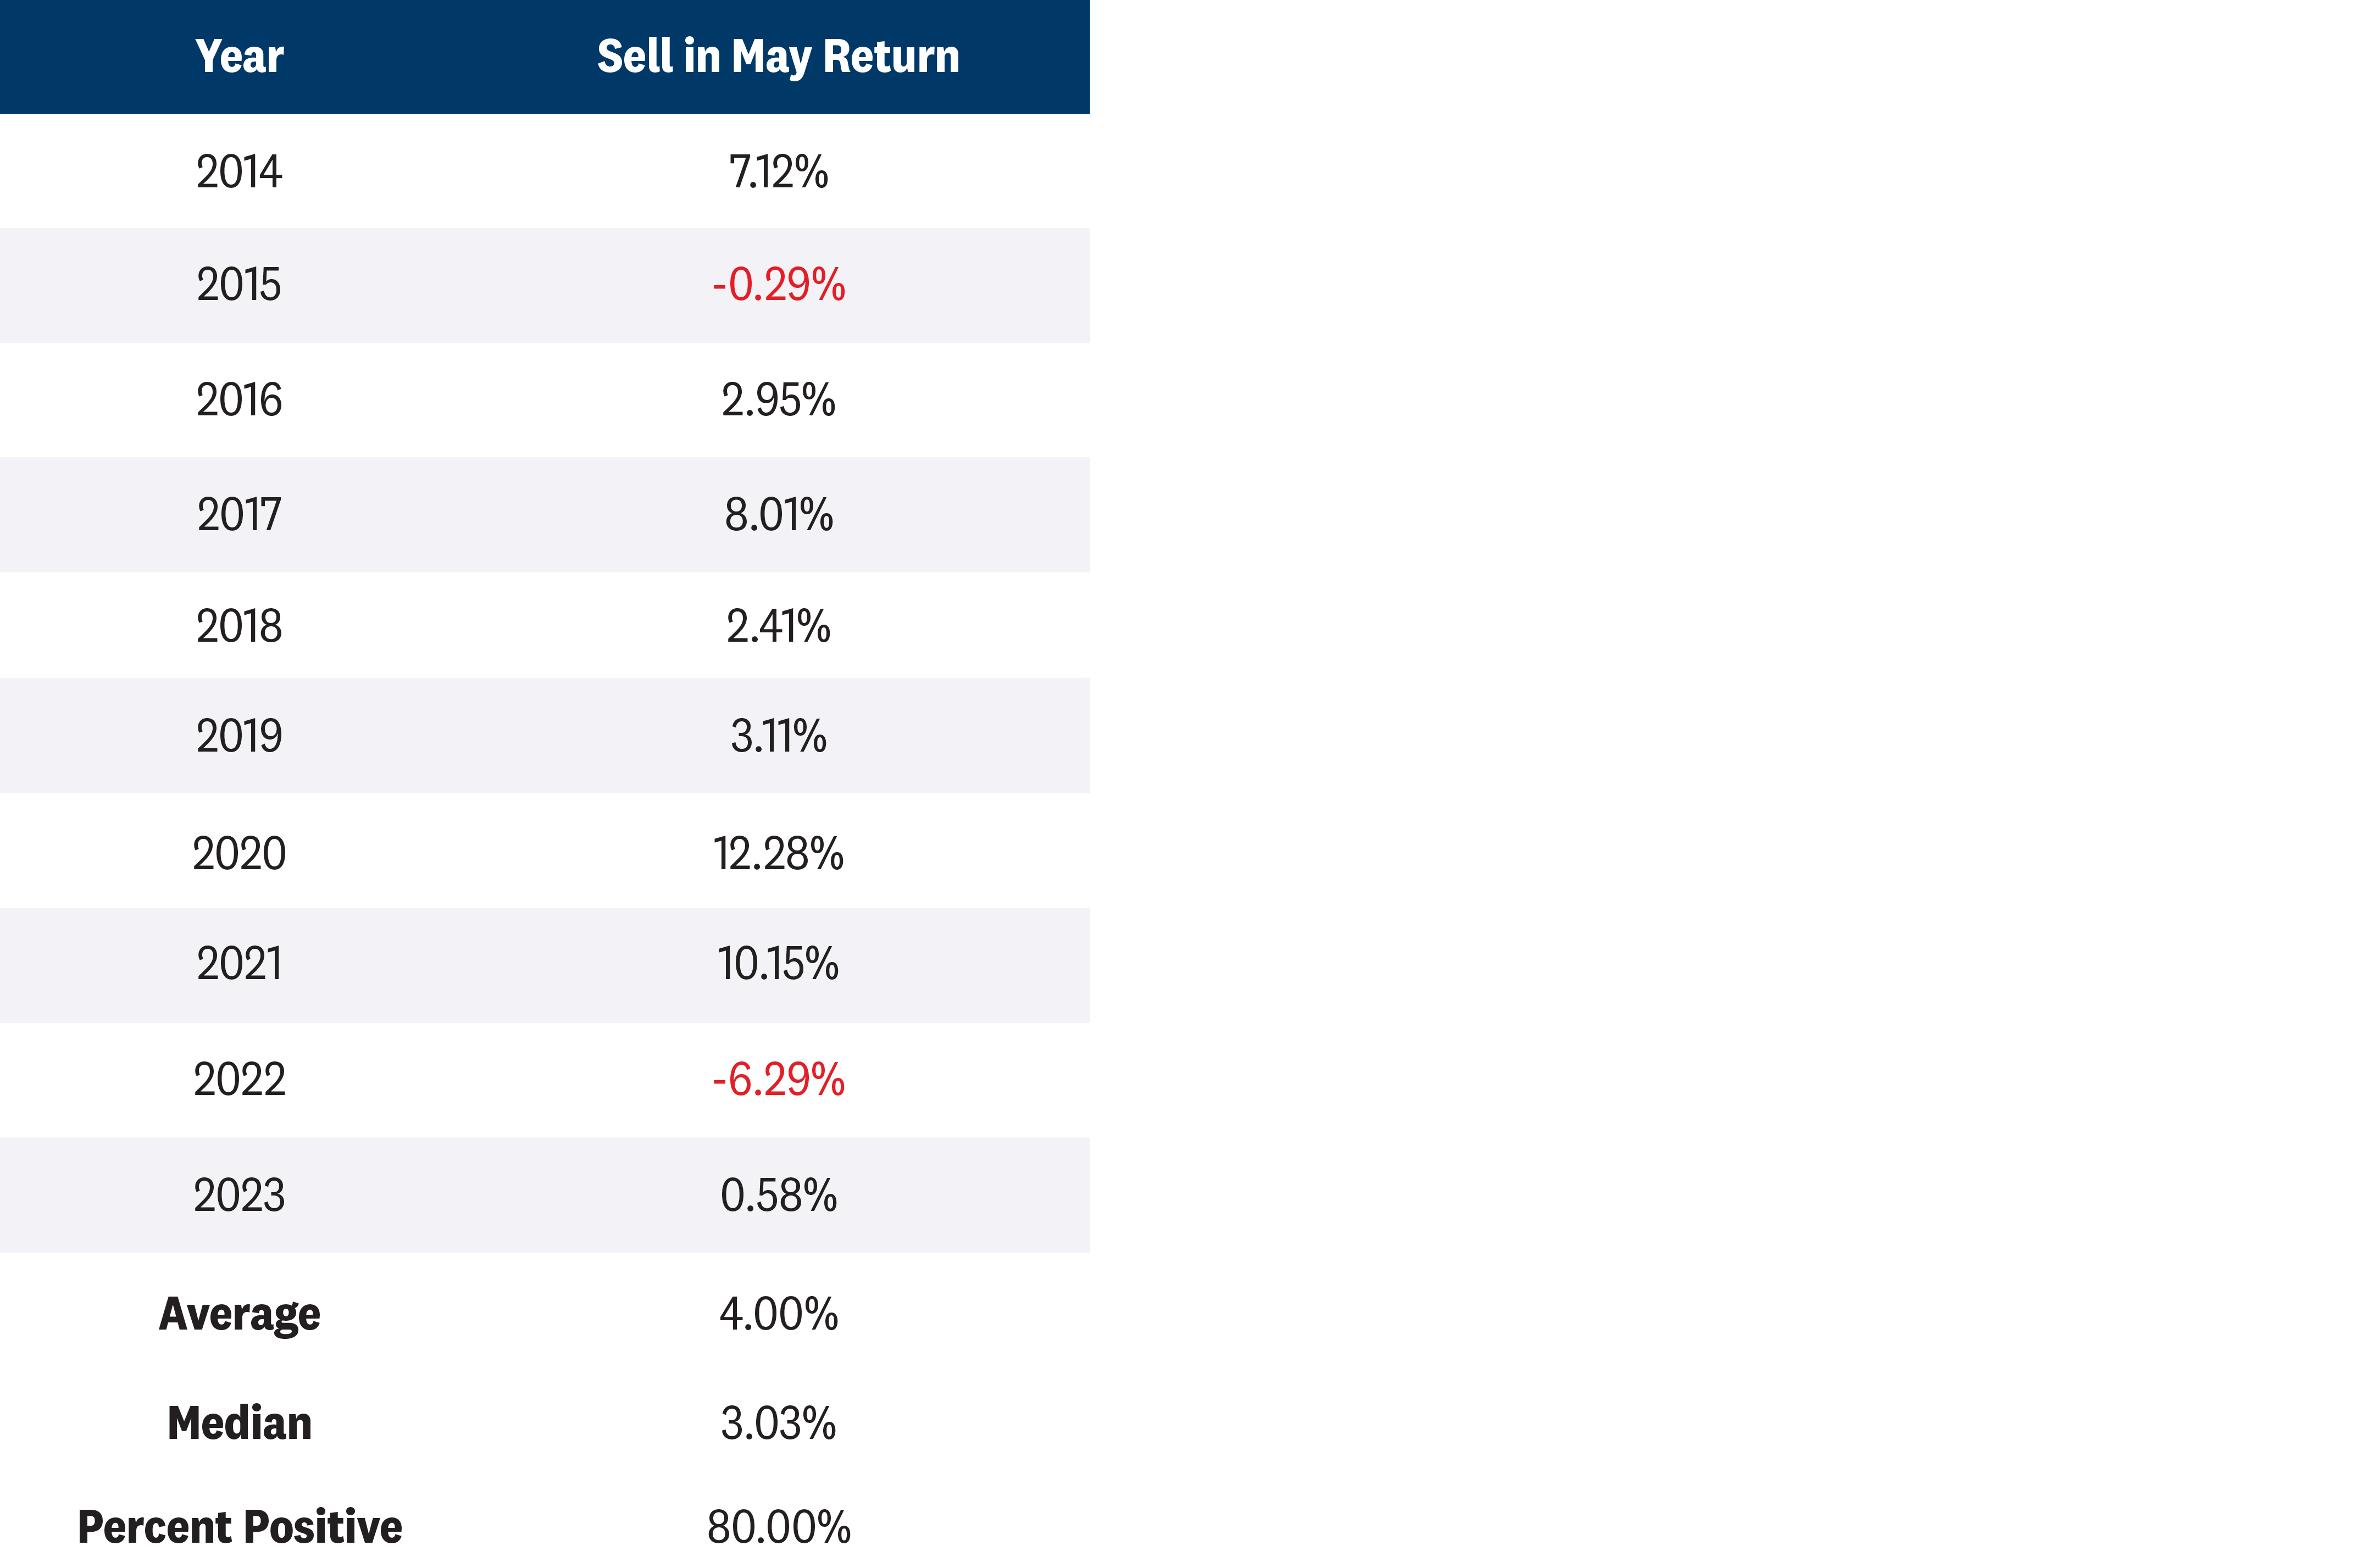
As highlighted below, May through November average returns have also been more constructive at 4.0%, with 80% of periods generating positive results.
Buy in May Has Been a Better Strategy More Recently
Finally, with the election now only six months away, we analyzed “Sell in May” returns during election years since 1952. The S&P 500 generated an average gain of 2.3% during these periods and finished higher 78% of the time.
What About Volatility?
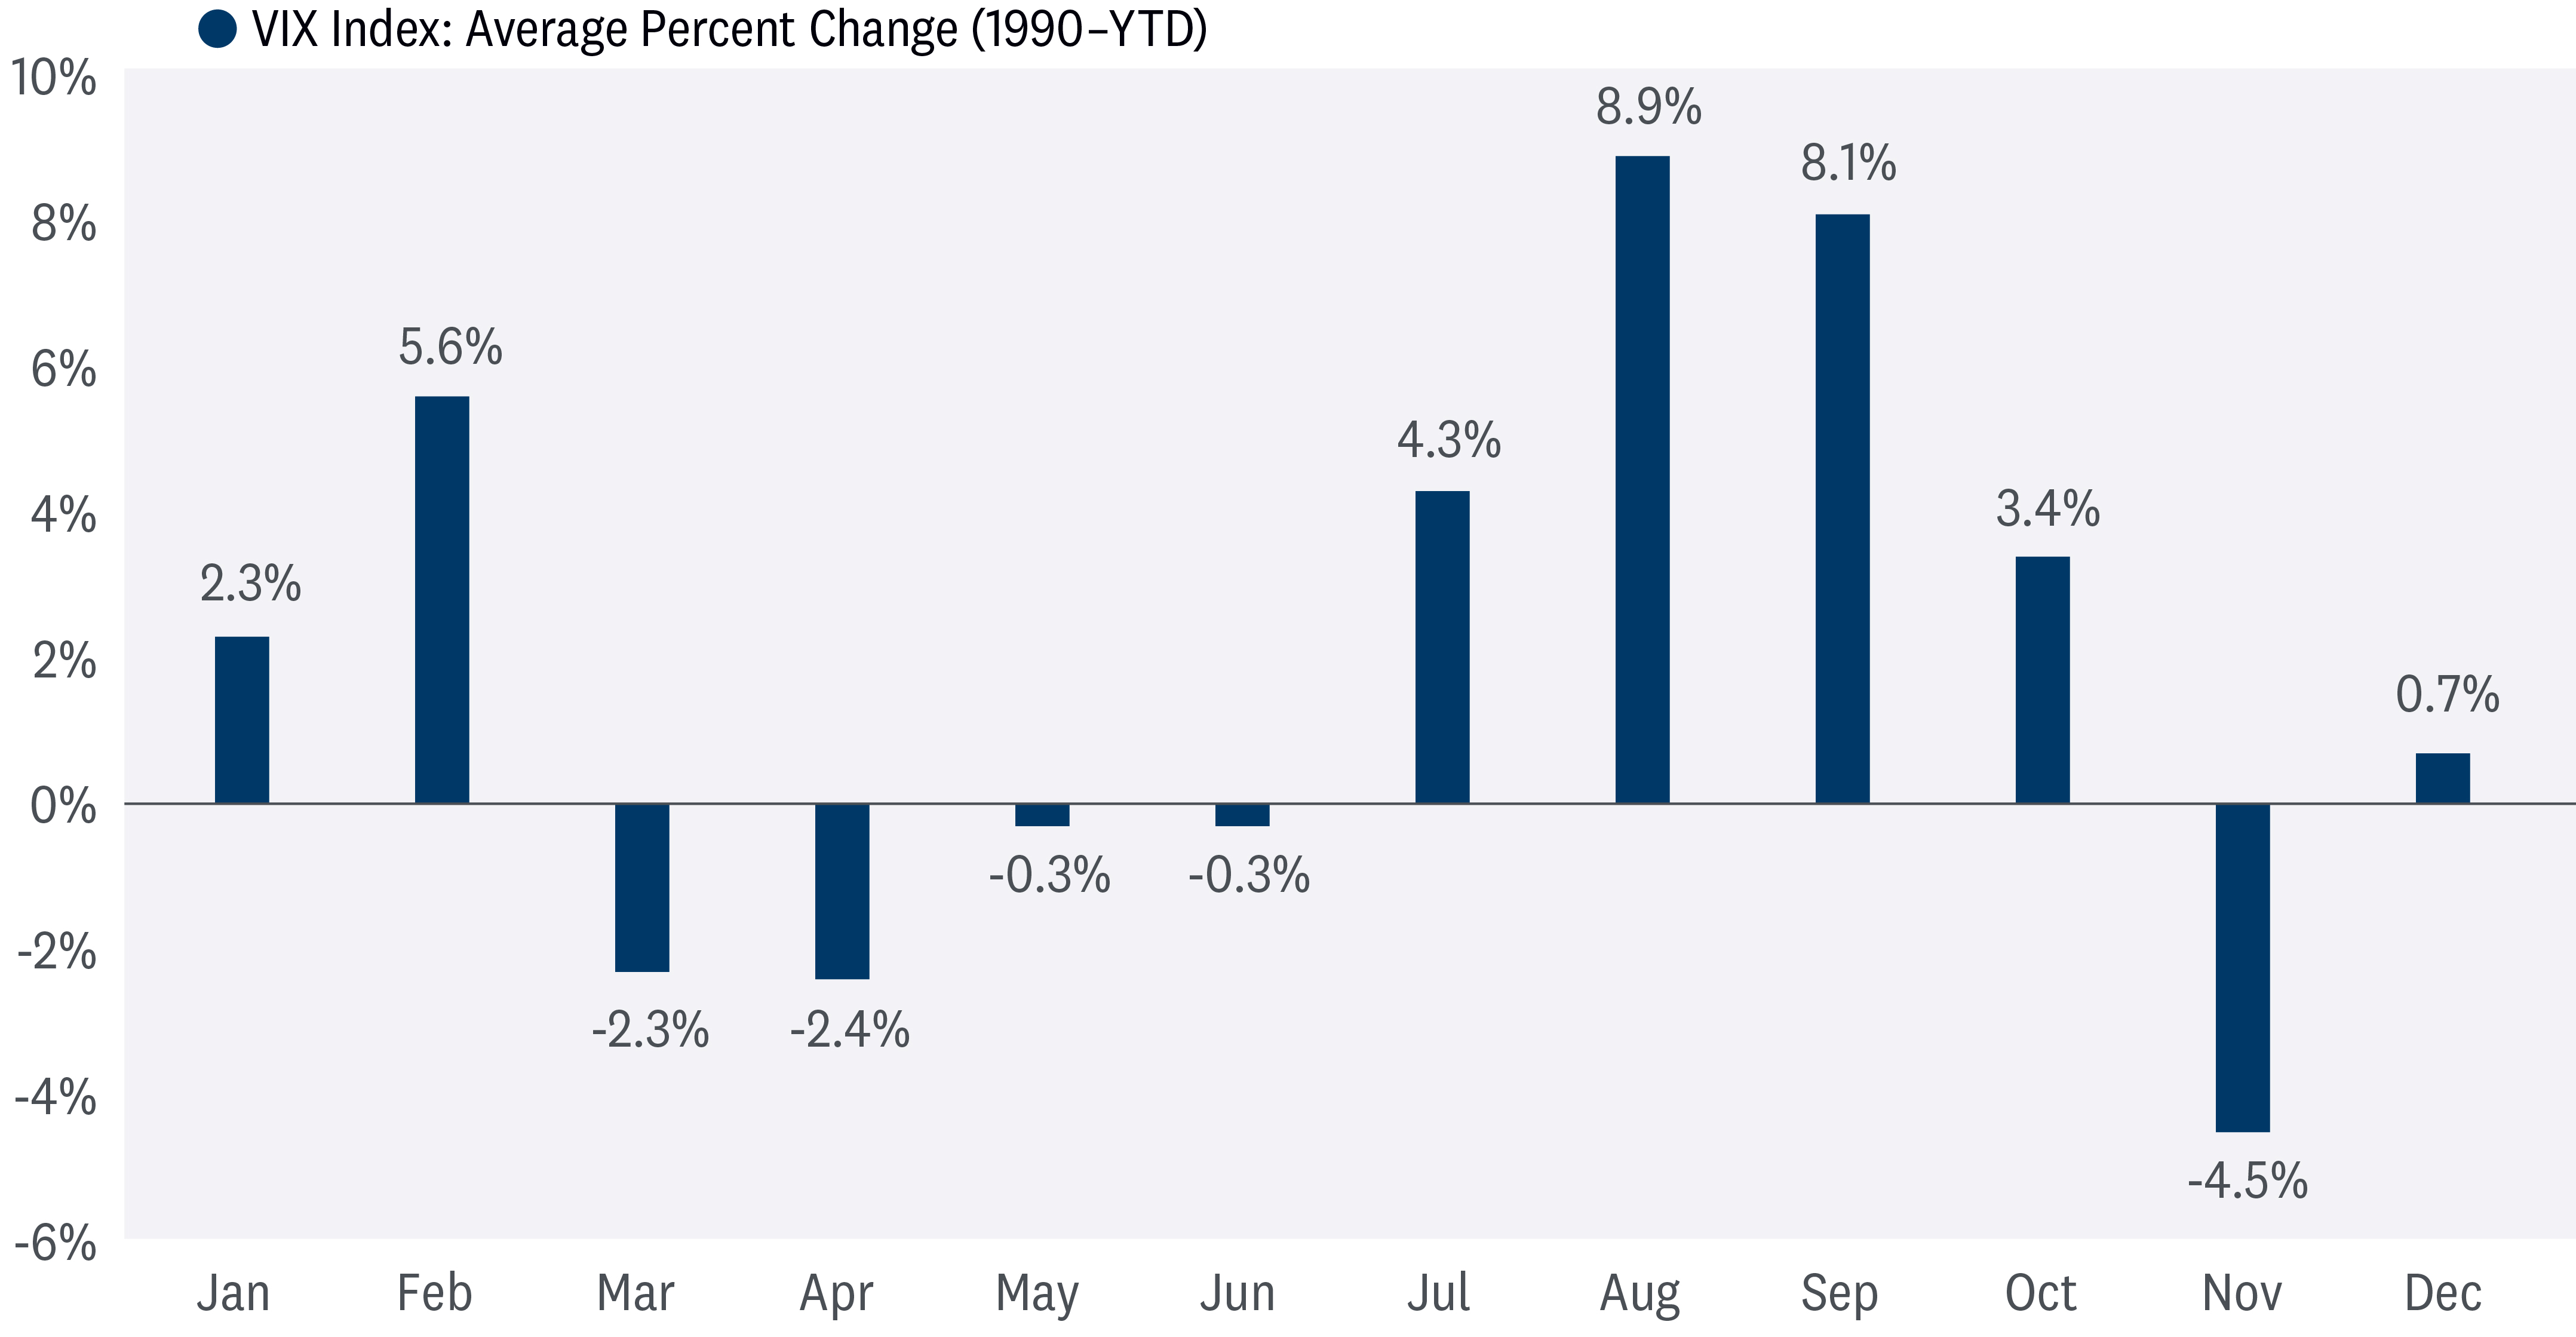
If you plan to stay invested through the “Sell in May” period — LPL Research recommends holding a neutral equity market position — volatility could be the price of admission. The CBOE Volatility Index, more commonly referred to as the VIX or “fear gauge,” historically advances from July through October, often peaking in late September or early October.
For reference, the VIX represents implied 30-day volatility derived from the aggregate values of a weighted basket of S&P 500 puts and calls over a range of strike prices. In general, the higher the VIX, the more fear and uncertainty there is in the market, and vice versa.
The monthly seasonality of the VIX is highlighted below.
“Sell in May” Months Can be Volatile
Monetary Policy Remains in the Driver’s Seat
Seasonality data can provide important insights into the potential market climate, but it doesn’t represent the current weather. And when it comes to markets, monetary policy has the power to make it rain or part clouds into sunshine. However, as we witnessed at last week’s Federal Open Market Committee (FOMC) meeting, policymakers appeared to be in no rush to cut rates, citing inflation’s lack of progress toward their 2% objective. Perhaps more importantly, Fed Chair Jerome Powell helped remove the dark clouds of a potential rate hike and stagflation fears hanging over the market, stating he doesn’t see the “stag” or the “flation” risks that have recently made headlines. While the meeting was less hawkish than feared, the Fed’s message did strengthen the higher-for-longer narrative, meaning we may not get a rate cut until September.
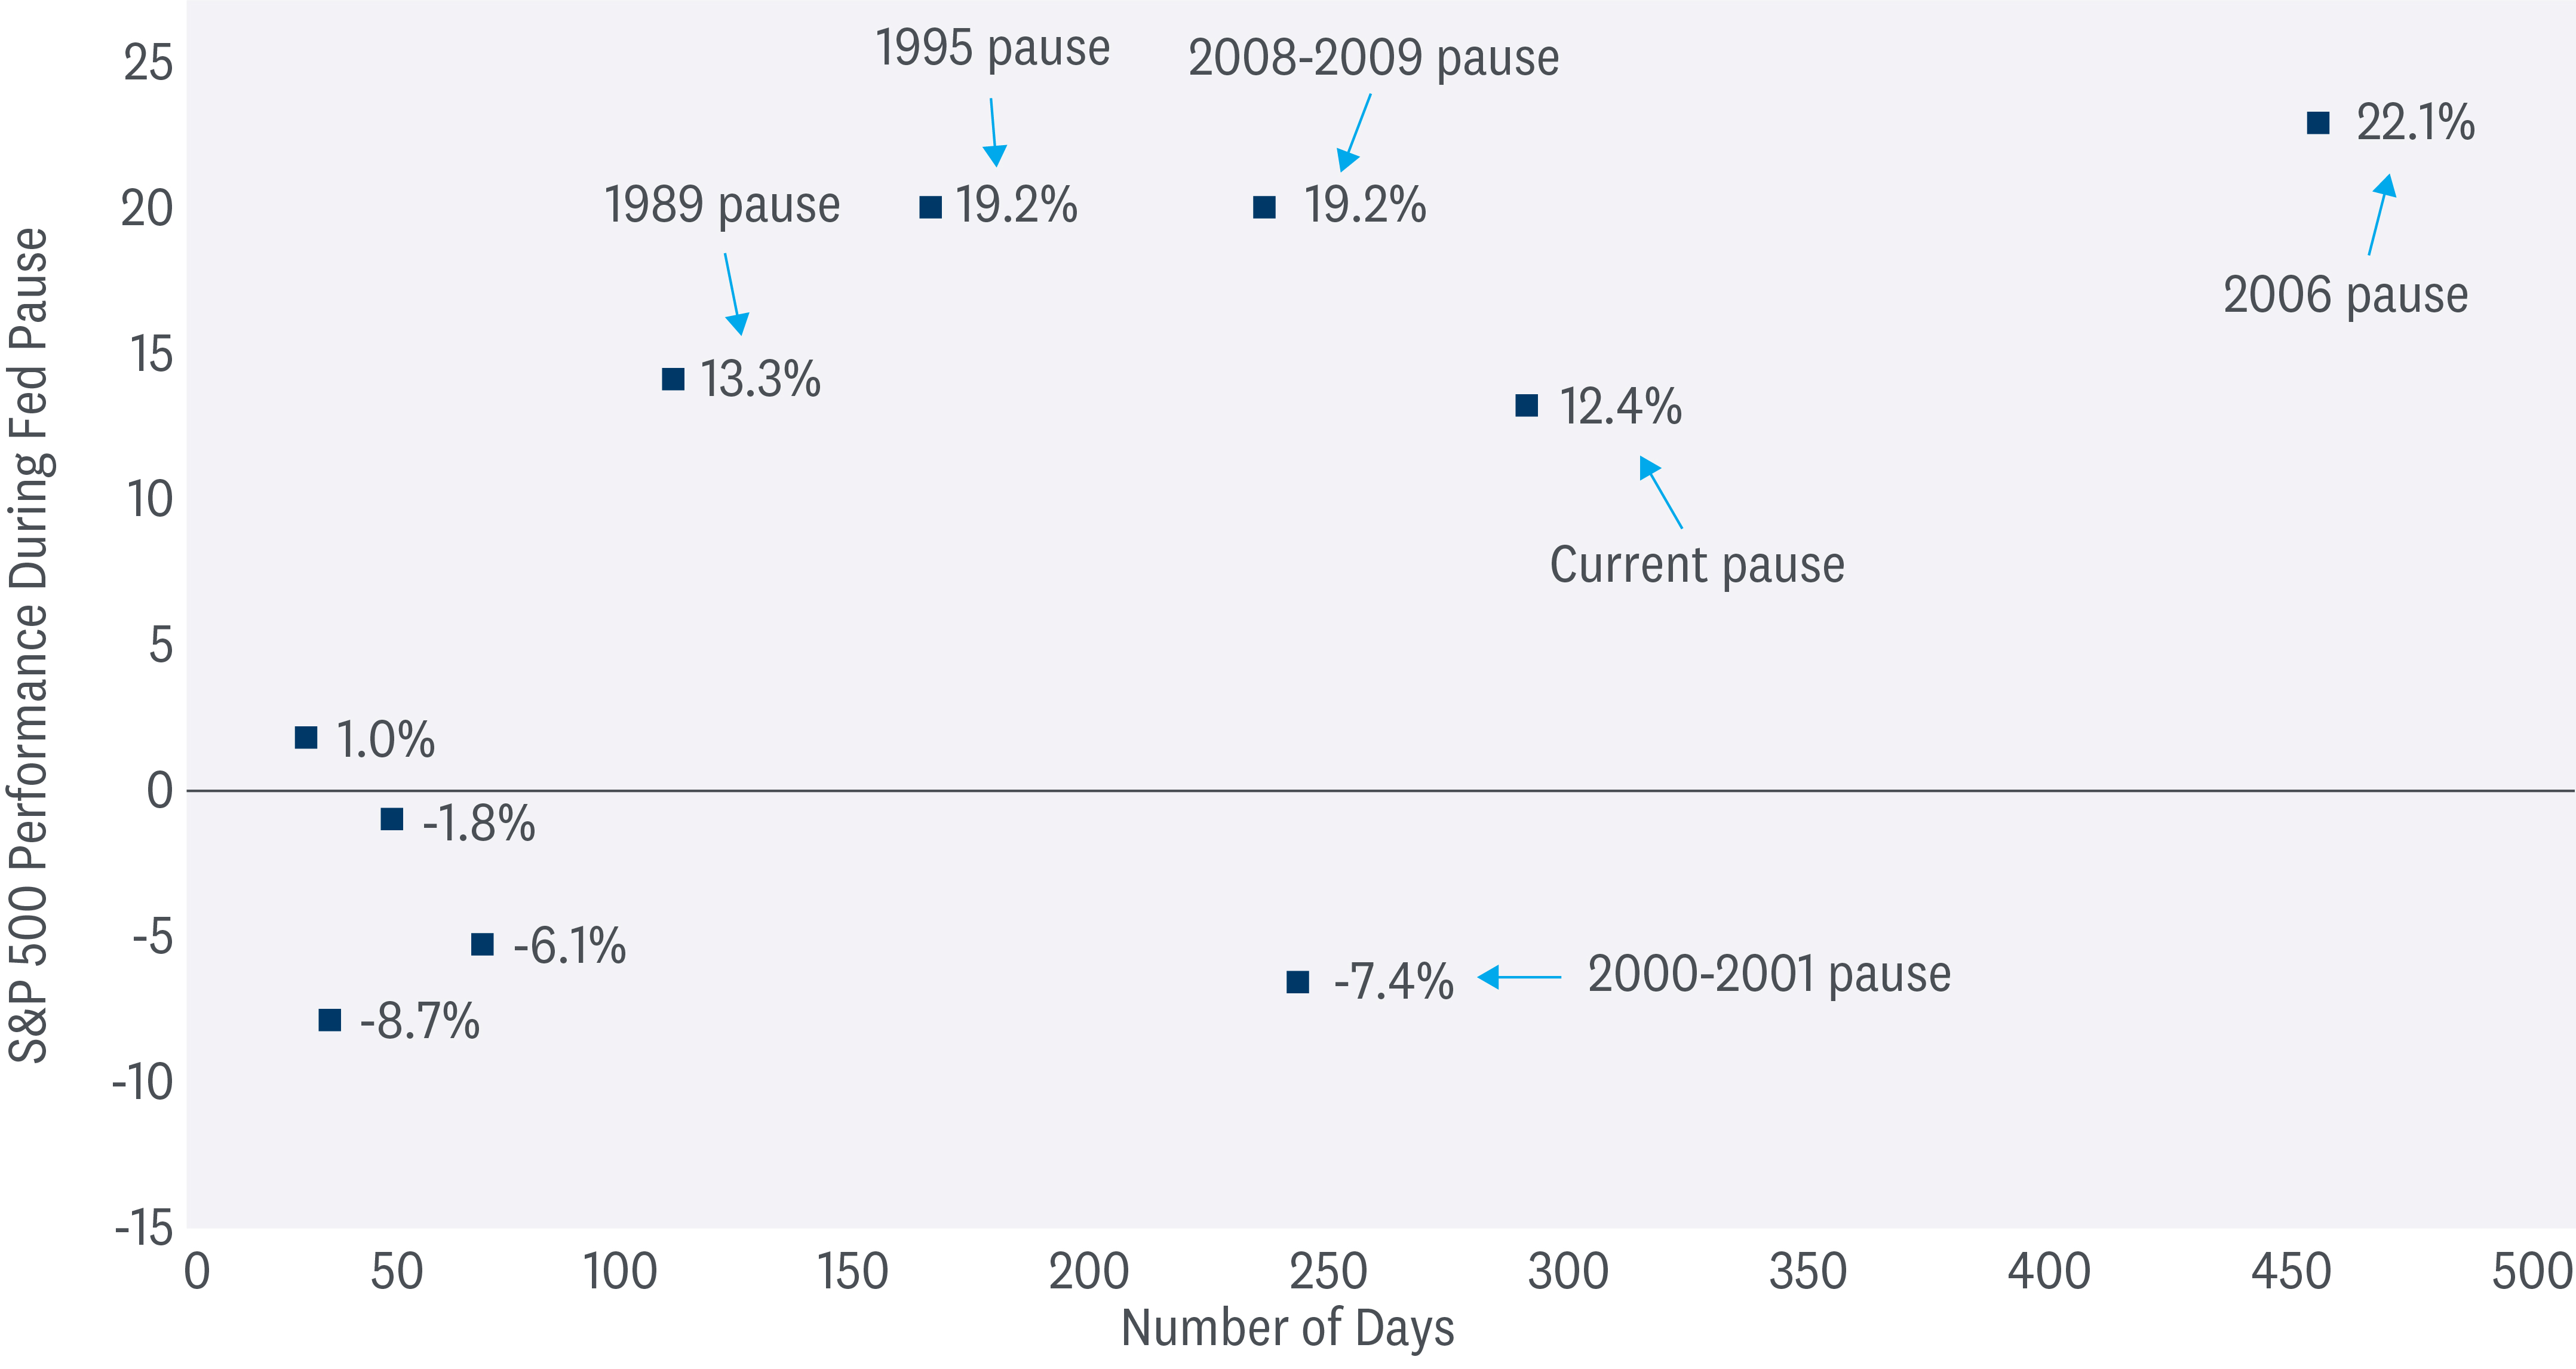
The current pause has now reached 280 days — the second-longest in modern market history, trailing only the 2006–07 pause that reached 446 days. The average Fed pause has lasted 146 days. The bearish angle on this statistic is that over the past 50 years, the S&P 500 has only gained 6% on average during pauses, and the gain during the current pause has reached 12.4%.
However, on a more positive note, over the last six pauses going back to 1989, the average gain has been 13.1%. This isn’t just cherry-picking — the last six pauses are the longest, which more closely mirror the ongoing pause. The 2000–01 pause was the one long pause when stocks fell. The S&P 500 lost 7% during that pause that was marred by recession and devastating accounting scandals.
Bottom line, long pauses aren’t typically bad for stocks. It’s when the Fed is forced to cut because of economic weakness that stocks tend to sell off — not the environment we’re in today.
Long Fed Pauses Tend to Overlap with Attractive Stock Market Gain
Summary
Seasonality trends point to a potentially softer period of market performance over the next six months. However, the “Sell in May and Go Away” maxim has been more rhyme than reason as the market historically trades higher from May through October, especially over the last 10 years when returns averaged 4.0%. The price for holding stocks during this period is historically high volatility (September and October are the most volatile months, as measured by the VIX). Finally, seasonality data is only one potential factor influencing markets and is far second to other key fundamental drivers such as the economy, earnings, and monetary policy.
Tactical Asset Allocation Insights
LPL’s Strategic and Tactical Asset Allocation Committee (STAAC) maintains its neutral equities stance tactically. The improved economic and earnings outlook this year has kept the risk-reward trade-off for stocks and bonds fairly well balanced, perhaps with a slight edge to bonds over stocks currently when looking out to year-end. Recent stubbornly high inflation readings likely delayed Fed rate cuts and may limit the upside to stock prices over the balance of the year, although two cuts may still come by year-end.
Within equities, on a tactical basis, the STAAC continues to favor a tilt toward domestic over international equities, with a preference for Japan among developed markets, and an underweight position in emerging markets (EM).
The Committee recommends a very modest tilt toward the growth style after reducing its overweight position in mid-March. Higher for longer and steady economic growth favors value in the short term, but once the disinflationary trend resumes and rates calm down, look for growth to benefit from its superior earnings power. Communication services and energy remain favored sectors.
Finally, the STAAC continues to recommend a modest overweight to fixed income, funded from cash.
Adam Turnquist, CMT, Chief Technical Strategist
Jeffrey Buchbinder, CFA, Chief Equity Strategist
You may also be interested in:
- That Was Quite a Week: A Pivotal One for the Markets – April 29, 2024
- Volatility Is Back: Understanding Ever-Changing Market Narrative – April 22, 2024
- Revisiting Energy: How Rate Cuts Could Benefit the Space – April 15, 2024
IMPORTANT DISCLOSURES
This material is for general information only and is not intended to provide specific advice or recommendations for any individual. There is no assurance that the views or strategies discussed are suitable for all investors or will yield positive outcomes. Investing involves risks including possible loss of principal. Any economic forecasts set forth may not develop as predicted and are subject to change.
References to markets, asset classes, and sectors are generally regarding the corresponding market index. Indexes are unmanaged statistical composites and cannot be invested into directly. Index performance is not indicative of the performance of any investment and do not reflect fees, expenses, or sales charges. All performance referenced is historical and is no guarantee of future results.
Any company names noted herein are for educational purposes only and not an indication of trading intent or a solicitation of their products or services. LPL Financial doesn’t provide research on individual equities.
All information is believed to be from reliable sources; however, LPL Financial makes no representation as to its completeness or accuracy.
The Standard & Poor’s 500 Index (S&P500) is a capitalization-weighted index of 500 stocks designed to measure performance of the broad domestic economy through changes in the aggregate market value of 500 stocks representing all major industries.
All index data from FactSet.
International investing involves special risks such as currency fluctuation and political instability and may not be suitable for all investors. These risks are often heightened for investments in emerging markets.
LPL Financial does not provide investment banking services and does not engage in initial public offerings or merger and acquisition activities.
The fast price swings of commodities will result in significant volatility in an investor’s holdings.
This research material has been prepared by LPL Financial LLC.
Securities and advisory services offered through LPL Financial (LPL), a registered investment advisor and broker-dealer (member FINRA/SIPC). Insurance products are offered through LPL or its licensed affiliates. To the extent you are receiving investment advice from a separately registered independent investment advisor that is not an LPL affiliate, please note LPL makes no representation with respect to such entity.
Not Insured by FDIC/NCUA or Any Other Government Agency | Not Bank/Credit Union Guaranteed | Not Bank/Credit Union Deposits or Obligations | May Lose Value |
RES 0001182-424W | For Public Use | Tracking #574718 (Exp. 05/2025)
Related Insights

November 4, 2024
Election Stock Market Playbook
SharePrinter Friendly Version As Election Day approaches, we discuss potential stock market implications of various possible outcomes. But before we …
Read More navigate_next
October 28, 2024
What Scares Us About the Economy and Markets
SharePrinter Friendly Version Stocks have done so well this year that it’s fair to say market participants haven’t feared much. …
Read More navigate_next