
High inflation continues to cloud the economic outlook while its impact on the potential path of rate hikes has left markets unsettled. Inflation is a serious topic, but occasionally it’s useful to revisit it from a lighter perspective. Today is Valentine’s Day, and as we do every year, LPL Research takes a look at changing prices from the perspective of some popular ways to celebrate the day with our annual Valentine’s Day Index. Do you want to know what you might be paying this year for a night in, a night out, a special piece of jewelry, or even a vacation? LPL Research has you covered.
Today is Valentine’s Day, a day when many celebrate romance, although the scope of the day has expanded to friendship and even just simple holiday fun. According to the National Retail Federation, Valentine’s Day ranks fourth in holiday spending, with average spending over the last three years well north of $150 per person. For those wondering what the holiday might cost compared to last year during this stretch of elevated inflation, LPL Research’s Valentine’s Day Inflation Index is the answer.
Give the Gift of Time…or Jewelry
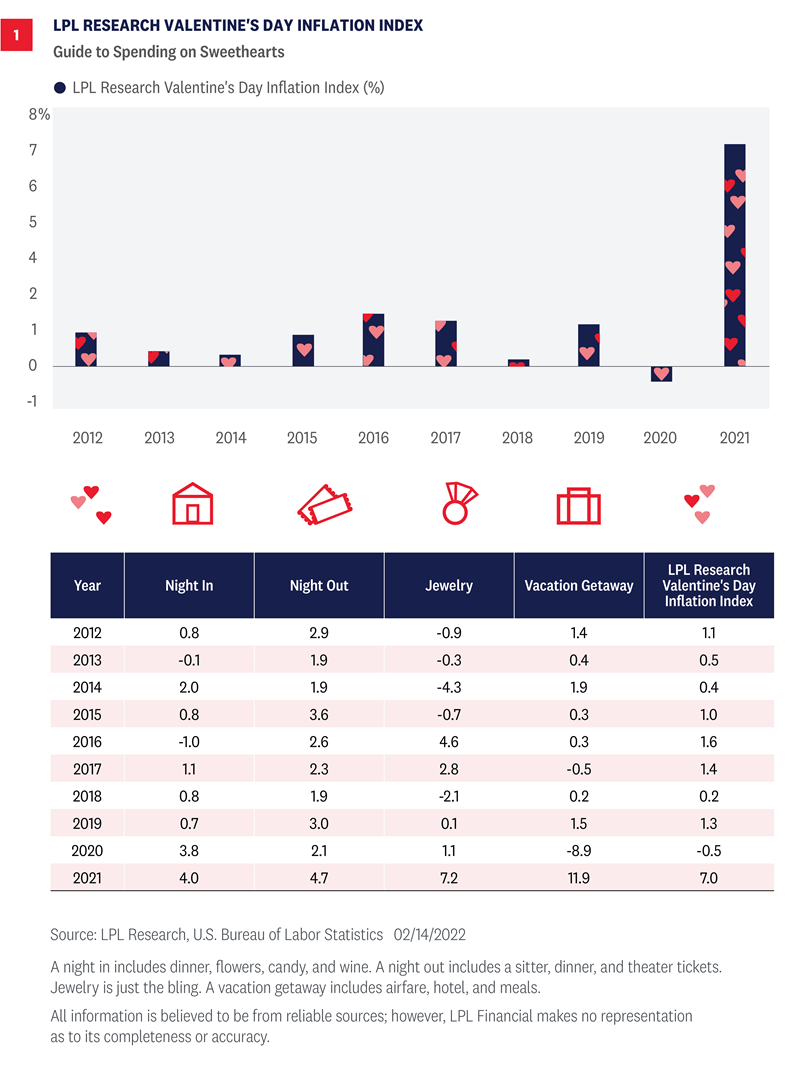
We’ve divided our Valentine’s Day Index into four components [Figure 1], capturing four favorite ways to celebrate the day. When it comes to romance the best gift is time together, and that’s where three of the four components are focused. In fact, it’s probably not bad general life advice to make spending time with the people you care about at least three times as important as material wants. Our three components for spending time together are a night in (a home-cooked meal, wine, flowers, and candy), a night out (dinner out, a sitter, and theater tickets), and a vacation getaway (airfare, lodging, and meals). If for whatever reason none of those quite fits your circumstances, it’s hard to go wrong with jewelry, which includes watches (hint hint). Of course, these can all be mixed and matched and there are budget options for each, but you’ll still need to deal with rising prices.
Inflation Hasn’t Hit Valentine’s Day as Hard
Thankfully, inflation hasn’t hit Valentine’s Day as hard as the broad economy. Our Valentine’s Day Index looks at annual prices, and while the index matches 2021 Consumer Price Index (CPI) inflation, at 7%, it’s lower beneath the surface. Two of three components (Night In and Night Out) are materially lower. Vacation Getaway inflation is higher, but that’s after a sharp COVID-19-related decline in 2020, so the two-year price movement is just under 1% a year. But even so, the Valentine’s Index is relatively affordable compared to inflation in the broad economy, and each component is still at a 10-year high.
The relative affordability of the Valentine’s Day Index is as much about what’s not in it as what is. Energy commodities (+49% in 2021) and used cars and trucks (+37%) are both noticeably absent. Some of the other categories that saw double- digit inflation in 2021 that you can avoid on Valentine’s Day: living room, kitchen and dining room furniture (+17%), washing machines (+12%), men’s suits (+11%), and new cars (+12%). Car rental (+36%) was also very high, so if you do travel choose an option where cabs or ride services will do.
A Night in and a Night Out Remain Relatively Affordable
Looking at the cost of an evening in, while prices for candy, a home cooked meal, and flowers were all roughly in line with core CPI inflation (which excludes food and energy), the fourth element, a glass of wine at home, has seen next to no price increase at all (In case you were wondering, the Bureau of Labor Statistics does specifically track the price of wine for home consumption). However, you may want to think about what you’re cooking since some food prices have climbed quite a lot. Prices for meat, poultry, fish, and eggs were up about 12% in 2021; fruits and vegetables were up about 5%; but your best option may be to skip dinner and go right to dessert sundaes, since dairy prices were only up about 2%.
Prices for a dinner out, up almost 7%, have climbed more quickly than a dinner in, but childcare costs have remained relatively restrained so it won’t cost you that much more in 2021 to hire a sitter, if you can find one. Responsible older siblings are always a good budget option, but take years of advance planning.
When it comes to a vacation getaway, hotel prices have picked up dramatically in the last year, up nearly 28% after falling 11% in 2020. Airfares also collapsed dramatically in 2020, falling almost 20%, but have barely budged in 2021, climbing a little over 1%. However, airfare costs are off to a soaring start in 2022, up over 2% in January alone, likely due to rising fuel costs.
Jewelry is the component that saw the largest price gain in 2020 and 2021 combined, at 4.1% annualized, but from 2012 to 2019 jewelry prices actually fell slightly, compared to gains in all other categories, so it’s probably not a bad time to potentially buy something sparkly for your sweetheart if that’s how you’re inclined.
Time is Still the Greatest Gift
We have fun with Valentine’s Day and the opportunity to treat ourselves and our loved ones with small extravagances. After almost two years of navigating COVID-19 and the impact it’s had on our lives, this year we especially relish the opportunity to stare down inflation and restrictions and celebrate with loved ones. In the big picture, Valentine’s Day is the ultimate budget holiday since time spent together is really what it’s all about. Inflation can’t touch that. Happy Valentine’s Day.
Ryan Detrick, CMT, Chief Market Strategist, LPL Financial
Barry Gilbert, PhD, CFA, Asset Allocation Strategist, LPL Financial
IMPORTANT DISCLOSURES
This material is for general information only and is not intended to provide specific advice or recommendations for any individual. There is no assurance that the views or strategies discussed are suitable for all investors or will yield positive outcomes. Investing involves risks including possible loss of principal. Any economic forecasts set forth may not develop as predicted and are subject to change.
References to markets, asset classes, and sectors are generally regarding the corresponding market index. Indexes are unmanaged statistical composites and cannot be invested into directly. Index performance is not indicative of the performance of any investment and do not reflect fees, expenses, or sales charges. All performance referenced is historical and is no guarantee of future results.
Any company names noted herein are for educational purposes only and not an indication of trading intent or a solicitation of their products or services. LPL Financial doesn’t provide research on individual equities.
All information is believed to be from reliable sources; however, LPL Financial makes no representation as to its completeness or accuracy.
US Treasuries may be considered “safe haven” investments but do carry some degree of risk including interest rate, credit, and market risk. Bonds are subject to market and interest rate risk if sold prior to maturity. Bond values will decline as interest rates rise and bonds are subject to availability and change in price.
The Standard & Poor’s 500 Index (S&P500) is a capitalization-weighted index of 500 stocks designed to measure performance of the broad domestic economy through changes in the aggregate market value of 500 stocks representing all major industries.
The PE ratio (price-to-earnings ratio) is a measure of the price paid for a share relative to the annual net income or profit earned by the firm per share. It is a financial ratio used for valuation: a higher PE ratio means that investors are paying more for each unit of net income, so the stock is more expensive compared to one with lower PE ratio.
Earnings per share (EPS) is the portion of a company’s profit allocated to each outstanding share of common stock. EPS serves as an indicator of a company’s profitability.
Earnings per share is generally considered to be the single most important variable in determining a share’s price. It is also a major component used to calculate the price-to-earnings valuation ratio.
All index data from FactSet.
This research material has been prepared by LPL Financial LLC.
Securities and advisory services offered through LPL Financial (LPL), a registered investment advisor and broker-dealer (member FINRA/SIPC). Insurance products are offered through LPL or its licensed affiliates. To the extent you are receiving investment advice from a separately registered independent investment advisor that is not an LPL affiliate, please note LPL makes no representation with respect to such entity.
Not Insured by FDIC/NCUA or Any Other Government Agency | Not Bank/Credit Union Guaranteed | Not Bank/Credit Union Deposits or Obligations | May Lose Value
RES-1043750-0222 | For Public Use | Tracking # 1-05243907 (Exp. 2/23)
Related Insights

November 4, 2024
Election Stock Market Playbook
SharePrinter Friendly Version As Election Day approaches, we discuss potential stock market implications of various possible outcomes. But before we …
Read More navigate_next
October 28, 2024
What Scares Us About the Economy and Markets
SharePrinter Friendly Version Stocks have done so well this year that it’s fair to say market participants haven’t feared much. …
Read More navigate_next