
Earnings Need to Do Some Heavy Lifting to Keep Rally Going
By Mueller Financial Services, July 17, 2023
Earnings season is upon us as some banks and a small handful of other blue chip companies have already reported results for their quarters ending June 30. The results on the surface probably won’t offer much to write home about given consensus estimates imply a 7% year-over-year decline in S&P 500 earnings per share. However, the key question is always what’s priced in, which at least offers an opportunity for markets to react positively, though our best guess is we get the typical upside surprises and guidance reductions, giving this rally a convenient excuse to take a breather.
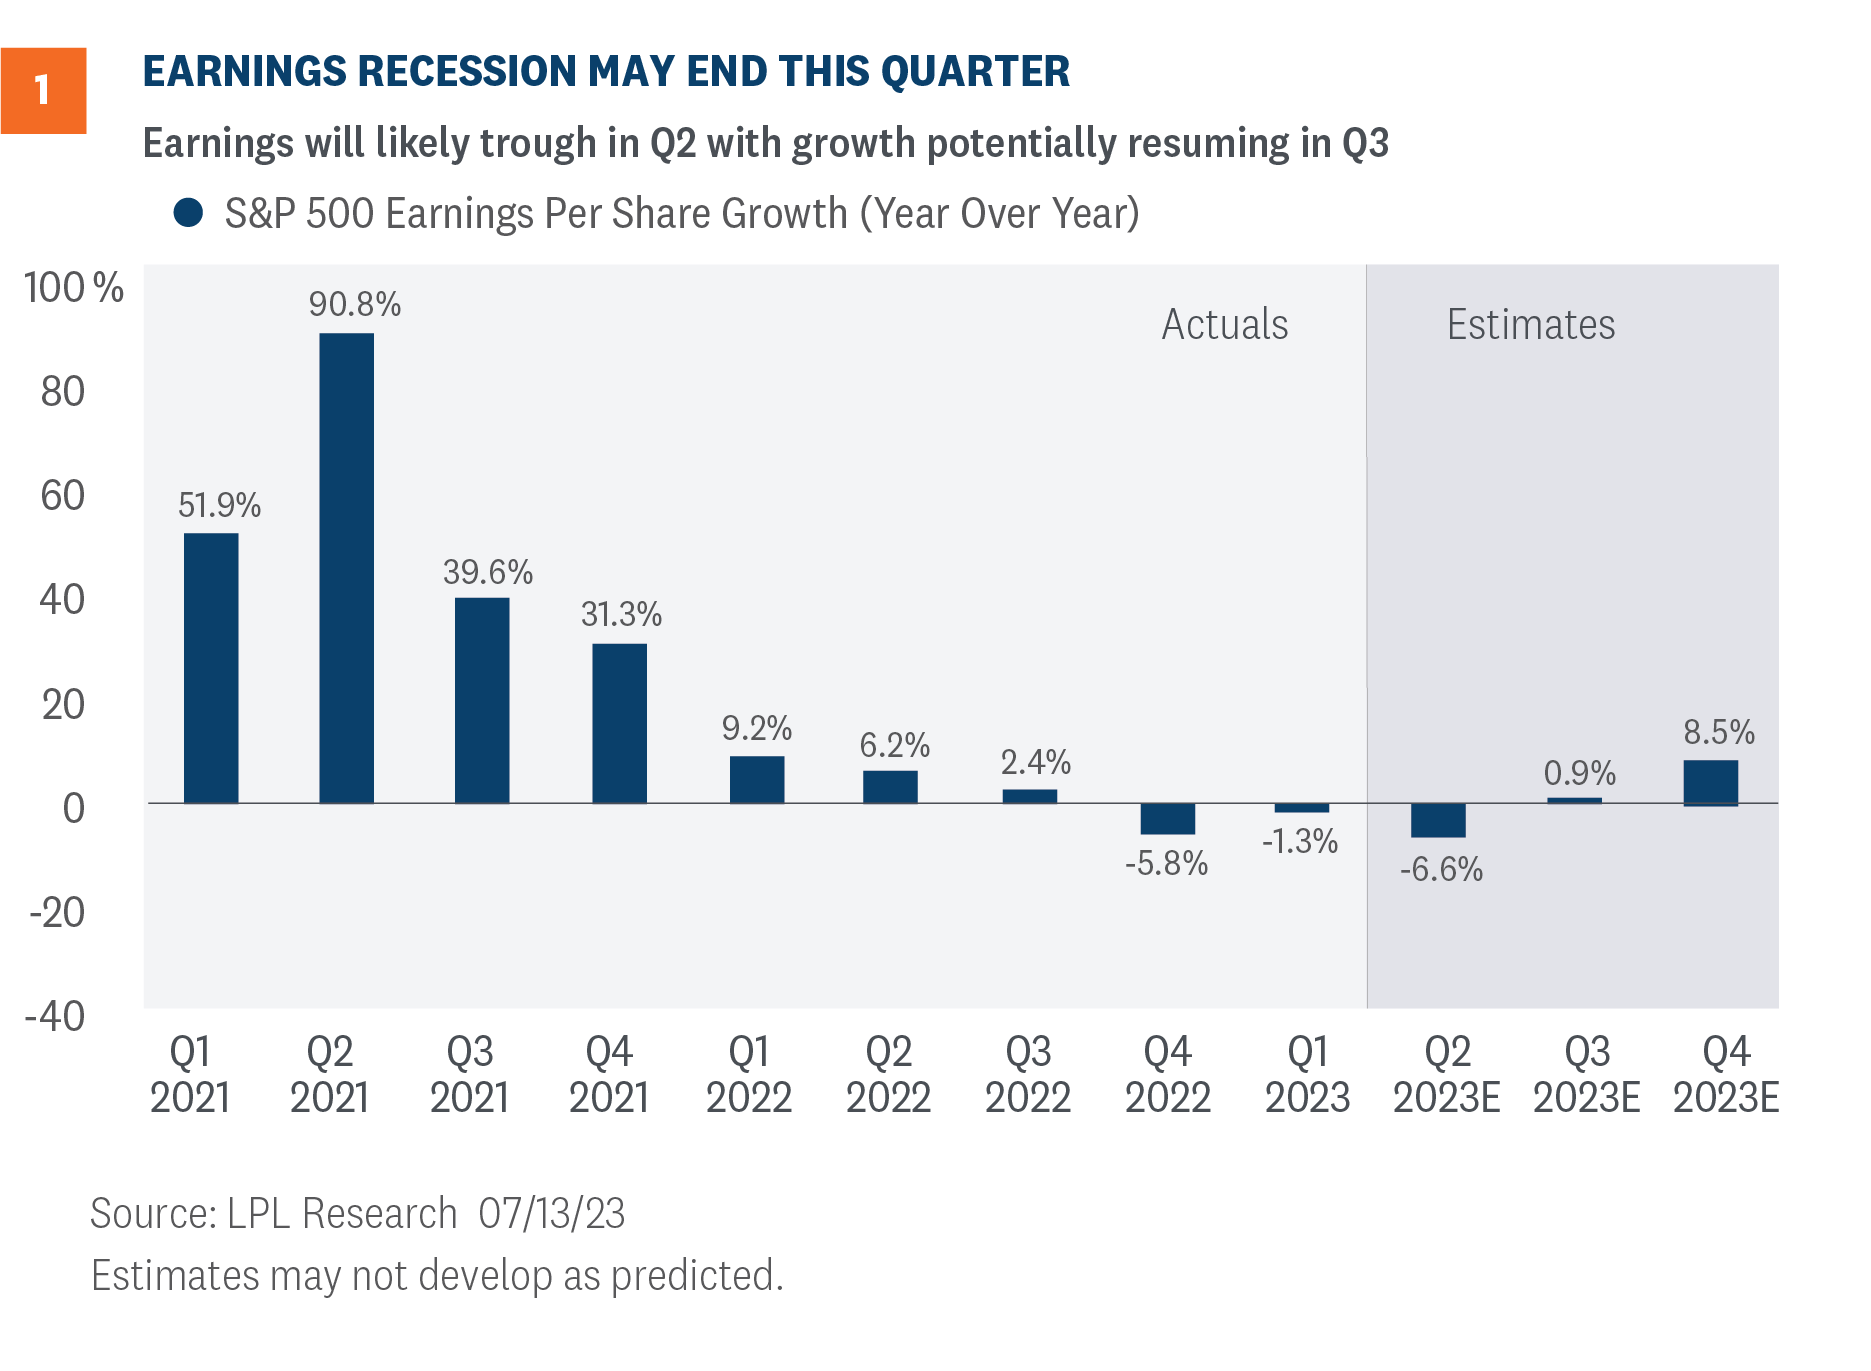
Earnings recession nearing an end
FactSet consensus estimates reflect a nearly 7% year-over-year decline in second quarter earnings for the S&P 500, slightly worse than the nearly 2% decline in the prior quarter. With the average upside historically around 3%, our baseline expectation is a 4% earnings decline for the quarter, meaning the earnings recession will likely continue for at least one more quarter. As shown in Figure 1, earnings may grow in the third quarter based on current consensus estimates, but it could be a close call because those estimates will likely be trimmed during the upcoming earnings season. Further weakness in the U.S. dollar could get us there because that would prop up non-U.S. earnings for multinational companies.
Indicators point to slightly above average surprise
To get a sense for whether results might diverge from that baseline expectation, we look at several factors that have correlated with earnings surprises historically:
- Pre-announcements. So far, about 41% of S&P 500 companies providing second quarter guidance have issued positive guidance, in line with the five-year average but higher than the 10-year average of 36%. This points to a typical beat.
- Early reporters. The average upside surprise for the 30 S&P 500 companies that have reported is 9%, with a 77% beat rate. This relatively strong start points to a modestly bigger-than-average beat.
- Estimate trends. The consensus second quarter EPS estimate for the S&P 500 fell 3% during the quarter, slightly better than the five and 10-year averages of -3.4% and pointing to slightly above average surprises.
- Economic surprise indexes. Whether looking at Citi’s version or Bloomberg’s, these popular measures of the frequency with which economic data beats expectations have both surged recently to historically high levels, pointing to an above-average beat.
- Manufacturing activity. This indicator points in the other direction. The Institute for Supply Management (ISM) Manufacturing Index averaged 46.7 during the second quarter, signaling earnings weakness. An earnings decline is consistent with this indicator and widely expected, and the economy has become increasingly services driven, so we would only slightly lower earnings expectations relative to consensus based on this one data point. Also note earnings beat by more than 5% last quarter when the ISM reading averaged 47.1.
Energy is the key detractor
From a sector perspective, the energy sector is projected to detract the most from earnings growth, with consensus estimates showing a 48% decline in profits amid the significant drop in oil prices over the last year. Conversely, the consumer discretionary and communications sectors are the only two sectors projected to record double-digit earnings growth (27% and 13%, respectively). The big names in consumer discretionary (Amazon/AMZN) and communications services (Meta Platforms/META and Alphabet/GOOG/L) are responsible for the majority of the anticipated earnings growth in these sectors. At the industry level, entertainment, hotels, restaurants and leisure, and wireless telecom are also expected to be material contributors.
Fundamentals matter
As valuations in the market remain fairly rich by most accounts, and interest rates—though inching lower as the Federal Reserve (Fed) prepares to potentially stand down—are still elevated, there are concerns the market won’t be able to absorb earnings misses as well as they have when valuations were more reasonable.
Accordingly, focusing on fundamentals will be more important during this earnings season as analysts will examine results from the top down and the bottom up amid questions about the effects of disinflation on the top line and margin pressures on the bottom line.
Focus on guidance
Corporate guidance, which looks ahead and provides a glimpse of what it sees with regard to the broader economy, coupled with insights regarding specific customer trends, will allow the market to form an educated judgment of where the economy is headed. Here are some things to watch during earnings season to help leverage these insights:
The macro picture. Given the focus on whether or not the economy is poised for a recession later this year, there will be an inordinate focus on how companies characterize the behavior of their primary customer base. This applies to both retail customers and corporate clients across a broad spectrum of industries.
Banking environment. In terms of the banking sector, the data that is provided on loan growth and loan payments can help assess the health of the broader economy. Similarly, credit card information offers an important profile on consumer debt and overall payment issues. Typically, large money center banks offer a general assessment of economic conditions, while smaller and regional banks provide a more in-depth examination of the economic landscape from their respective locations. Together, analysts can form a more reliable perspective on the health of the economy. Favorable comments about the lending environment from JPMorgan Chase (JPM) and Wells Fargo (WFC) in their earnings releases last week were reassuring.
Cost-cutting trends. Investors will be on alert for indications that companies need to cut costs in order to maintain their operating margins, because this typically involves trimming payrolls. With a still resilient labor market underpinning the consumer, any signs that companies need to reduce headcount could adjust projections for a marked economic slowdown or a recession.
With consumer spending responsible for approximately 68% of GDP, corporate guidance is increasingly important during this period.
Looking ahead to the second half
As we noted in the Midyear Outlook 2023: The Path Toward Stability released last week, we expect earnings to decline slightly this year. But analysts have continued to underestimate corporate America’s ability to generate revenue and control costs. Even though inflation is coming down, higher prices boost revenue and consumers continue to absorb elevated prices relatively well. In addition, S&P 500 companies saw an unexpected, albeit slight, uptick in margins overall in the first quarter, suggesting additional pressure on margins may be limited. Also encouraging is consumer inflation, though falling, is well above wholesale inflation. Expect companies to use their efficiency playbooks in the second half to continue to mitigate margin compression from waning demand and lingering cost pressures.
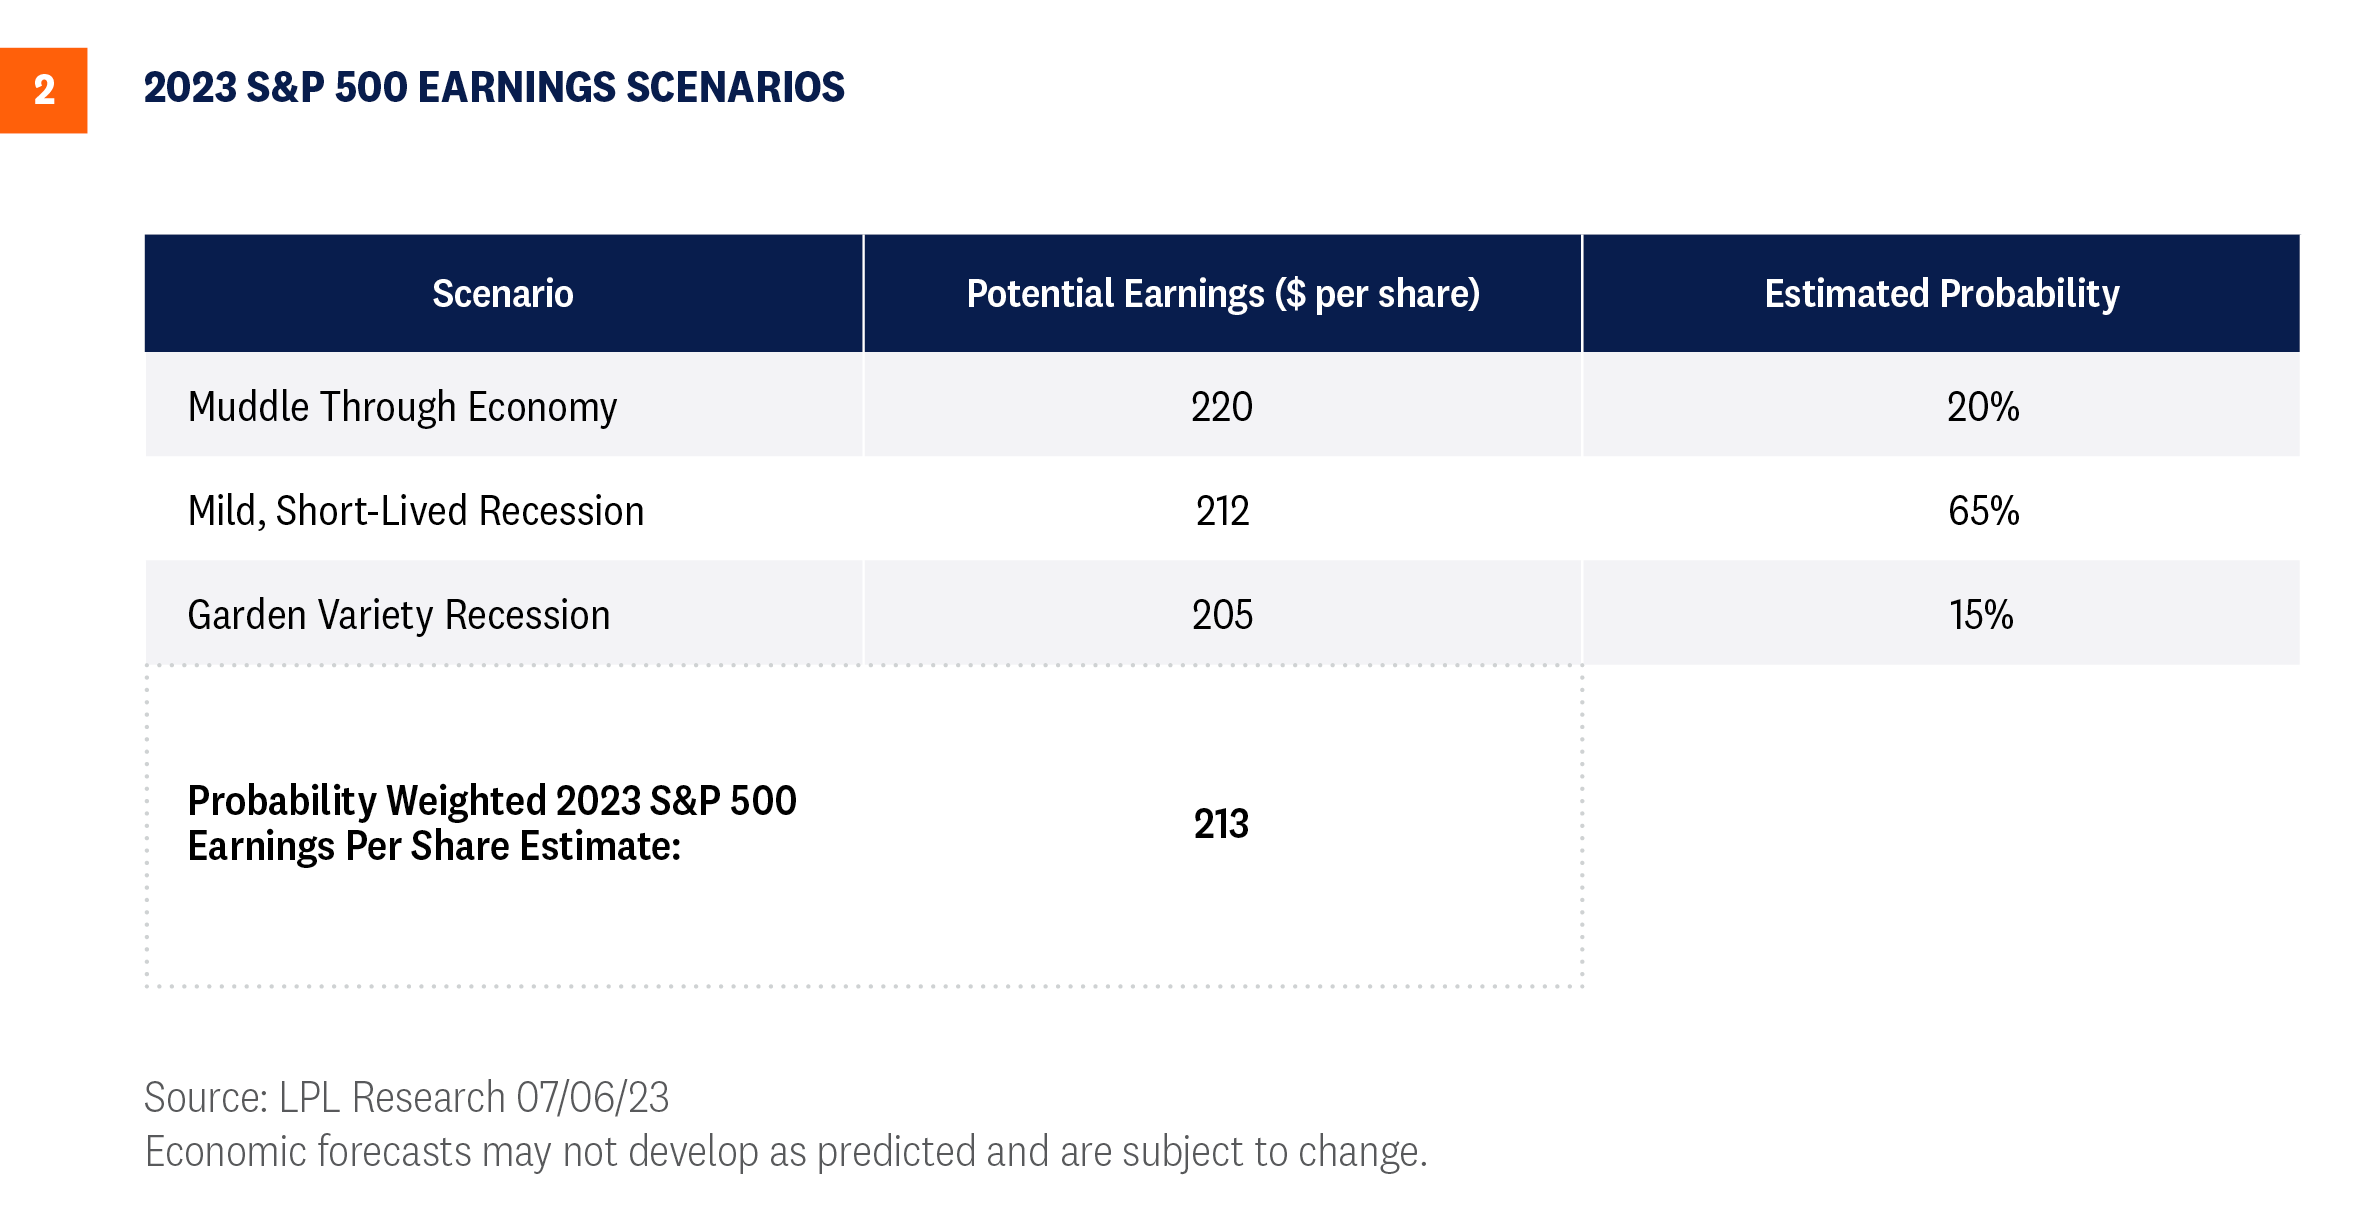
For now, given heightened economic uncertainty, we use a weighted probability approach to forecast earnings for this year. Based on estimated probabilities of these scenarios, as shown in Figure 2, we arrive at our 2023 S&P 500 earnings per share forecast of $213, slightly below 2022 levels. Though the market’s expectations for earnings have improved of late, we still see sufficient pessimism to support modestly higher stock prices if actual results come in near our bull case “soft landing” scenario. But the bar has been raised.
Looking to 2024, corporate America may get off to a slow start as recession potentially spills over. But as inflation continues to come down, helping to ease cost pressures, and economic growth potentially picks up, high-single-digit earnings growth may still be achievable. Our estimated S&P 500 EPS for 2024 is $230, up about 8% from our 2023 estimate.
Investment conclusion
Stocks have added some to strong first half gains so far in July, pushing the S&P 500 over 4,500 and within 6% of a new all-time high. While this latest rally may have outpaced fundamentals and our fair value assessment in the short term, the U.S. economy and corporate America have remained resilient. The latest data, including easing consumer and wholesale inflation reported last week, slightly raised the odds of a soft landing for the U.S. economy, though our base case still calls for a mild and short-lived recession to begin by year-end. A Fed pause is increasingly likely later this month, supporting the case for staying fully invested.
LPL’s Strategic and Tactical Asset Allocation Committee (STAAC) recommends a neutral tactical allocation to equities, with a modest overweight to fixed income funded from cash. The risk-reward trade-off between stocks and bonds looks relatively balanced to us, with core bonds providing a yield advantage over cash. A Fed pause has historically been a positive for core bond investors.
The STAAC recommends being neutral on style, favors developed international equities over emerging markets and large caps over small, and maintains the industrials sector as its top overall sector pick.
Within fixed income, the STAAC recommends an up-in-quality approach with benchmark-level interest rate sensitivity. We think core bond sectors (U.S. Treasuries, agency mortgage-backed securities (MBS), and short-maturity investment grade corporates) are currently more attractive than plus sectors (high-yield bonds and non-U.S. sectors) with the exception of preferred securities, which look attractive after having sold off due to stresses in the banking system.
Jeffrey Buchbinder, CFA, Chief Equity Strategist
Dr. Quincy Krosby, PhD, Chief Global Strategist
You may also be interested in:
- Capital Markets: The Essence of American Capitalism – July 3, 2023
- The New Standard and Poor’s 500 Bull Needs a Breather – June 26, 2023
- Market Responses to Fed (In)Action – June 20, 2023
IMPORTANT DISCLOSURES
This material is for general information only and is not intended to provide specific advice or recommendations for any individual. There is no assurance that the views or strategies discussed are suitable for all investors or will yield positive outcomes. Investing involves risks including possible loss of principal. Any economic forecasts set forth may not develop as predicted and are subject to change.
References to markets, asset classes, and sectors are generally regarding the corresponding market index. Indexes are unmanaged statistical composites and cannot be invested into directly. Index performance is not indicative of the performance of any investment and do not reflect fees, expenses, or sales charges. All performance referenced is historical and is no guarantee of future results.
Any company names noted herein are for educational purposes only and not an indication of trading intent or a solicitation of their products or services. LPL Financial doesn’t provide research on individual equities.
All information is believed to be from reliable sources; however, LPL Financial makes no representation as to its completeness or accuracy.
All investing involves risk, including possible loss of principal.
US Treasuries may be considered “safe haven” investments but do carry some degree of risk including interest rate, credit, and market risk. Bonds are subject to market and interest rate risk if sold prior to maturity. Bond values will decline as interest rates rise and bonds are subject to availability and change in price.
The Standard & Poor’s 500 Index (S&P500) is a capitalization-weighted index of 500 stocks designed to measure performance of the broad domestic economy through changes in the aggregate market value of 500 stocks representing all major industries.
The PE ratio (price-to-earnings ratio) is a measure of the price paid for a share relative to the annual net income or profit earned by the firm per share. It is a financial ratio used for valuation: a higher PE ratio means that investors are paying more for each unit of net income, so the stock is more expensive compared to one with lower PE ratio.
Earnings per share (EPS) is the portion of a company’s profit allocated to each outstanding share of common stock. EPS serves as an indicator of a company’s profitability. Earnings per share is generally considered to be the single most important variable in determining a share’s price. It is also a major component used to calculate the price-to-earnings valuation ratio.
All index data from Bloomberg.
For a list of descriptions of the indexes and economic terms referenced in this publication, please visit our website at lplresearch.com/definitions.
This research material has been prepared by LPL Financial LLC.
Securities and advisory services offered through LPL Financial (LPL), a registered investment advisor and broker -dealer (member FINRA/SIPC). Insurance products are offered through LPL or its licensed affiliates. To the extent you are receiving investment advice from a separately registered independent investment advisor that is not an LPL affiliate, please note LPL makes no representation with respect to such entity.
Not Insured by FDIC/NCUA or Any Other Government Agency | Not Bank/Credit Union Guaranteed | Not Bank/Credit Union Deposits or Obligations | May Lose Value |
RES-1580014-0623 | For Public Use | Tracking #1-05375398 (Exp. 07/24)
Related Insights

November 4, 2024
Election Stock Market Playbook
SharePrinter Friendly Version As Election Day approaches, we discuss potential stock market implications of various possible outcomes. But before we …
Read More navigate_next
October 28, 2024
What Scares Us About the Economy and Markets
SharePrinter Friendly Version Stocks have done so well this year that it’s fair to say market participants haven’t feared much. …
Read More navigate_next