
A Cloudy Outlook Makes for Choppy Markets
By Mueller Financial Services, July 31, 2023
The economy is doing better than expected, and the markets are responding accordingly. In this piece, we discuss some of the factors that cause us to think the Federal Reserve (Fed) hiked for the last time in this cycle as inflation is receding and the outlook for the consumer looks cloudy. We close the piece with investment implications.
Key Takeaways
- Fixed income markets are volatile as the macro outlook is unclear.
- Growth for the latter half of the year could be much softer than the first half.
- Credit card debt reached a new record high at a difficult time when credit card rates spiked.
- A Fed pause is increasingly likely in September, supporting the case for staying fully invested
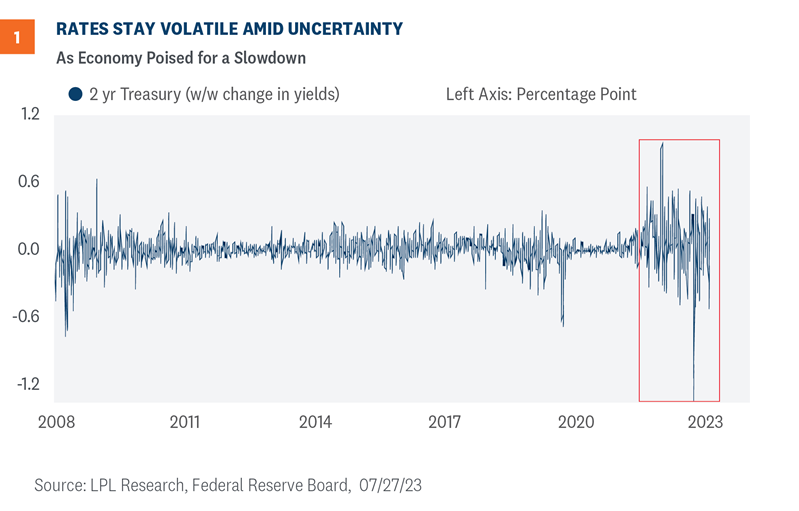
Yields are especially volatile
Yields on the 2-year Treasury note are more volatile now compared to a few years ago. As shown in Figure 1, the week to week change in yields has been larger during the past two years than they were in previous years and are unnervingly similar to behavior during the Great Financial Crisis (to be clear, we do not expect a repeat of 2008). Investors seem to have strong opinions about the direction of the economy, but the lack of clarity has made the fixed income market especially volatile. What we do know is that after the most aggressive rate hiking campaign in decades, the Fed headwind could be coming to an end, which has historically been a good environment for core bonds.
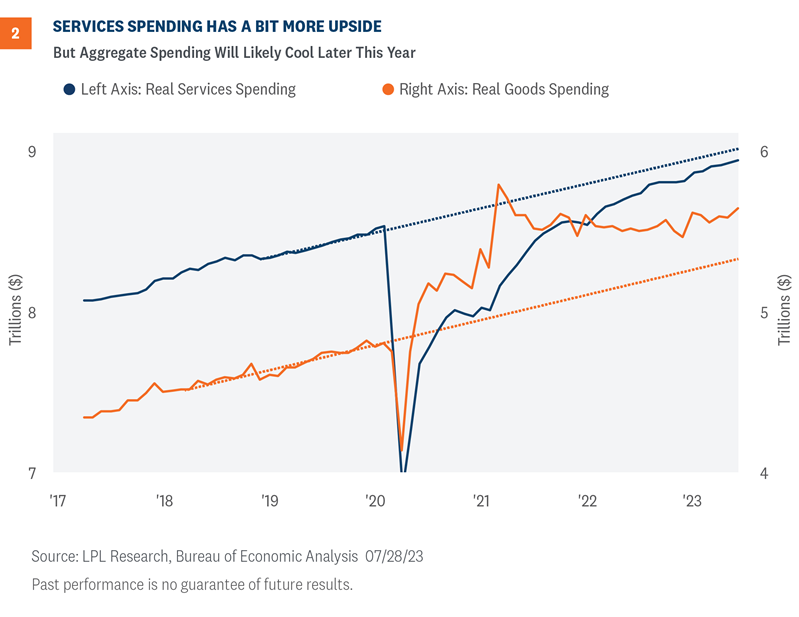
Future path of growth predicated on the consumer
As shown in Figure 2, consumers are not yet back to trend growth for services. Positive real disposable income growth and credit have supported spending habits in the near-term, but it’s hard to say this will continue since consumers will eventually be impacted from record-high credit card rates on all-time high outstanding balances. We know from the latest consumer data that individuals are demanding less durable and nondurable goods, and a slowdown in demand for services looks increasingly likely with consumers under the weight of tighter credit conditions.
As it relates to general market sentiment, investors can find plenty of both bears and bulls, but maybe the bulls are in the majority. One reason for the wide dispersion of views and the plethora of bulls is the substantial upside surprises in macro data and earnings. The frequency with which economic data beats expectations has surged recently to historically high levels, lowering the probability of a recession this year.
As it relates to equities, consumer discretionary is tracking to a 36.3% year-over-year earnings gain, with a 14% average upside—the biggest positive surprise so far among the 11 S&P sectors. Overall, S&P 500 earnings are surprising by an average of 6%.
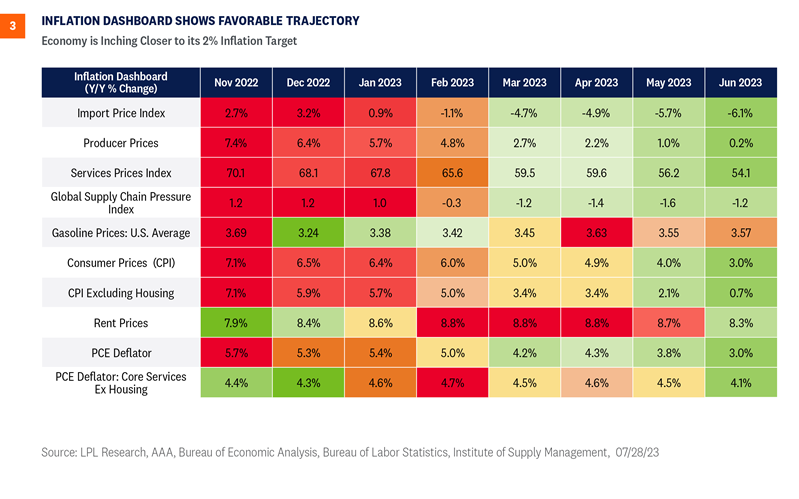
Inflation dynamics appear more favorable
The Fed’s preferred annual inflation metric decelerated to 2.96% in June from 3.82% the previous month as overall inflation pressures eased. Core inflation, excluding food and energy, also decelerated to 4.1% in June from 4.6%. Goods prices in June are outright lower than they were a year ago, for both durable and nondurable goods, revealing the decline in consumer demand for goods. Services prices are driving the inflationary dynamics right now as the services spending splurge continues.
Goods prices declined three of the last four months, pulling the annual rate of goods inflation down to -0.6%, the lowest since 2020. Services inflation is also cooling, but it’s still too high as consumers concentrate their spending on services. If inflation metrics continue to cool, investors should expect the Fed to pause at their next meeting in September. The key takeaway for investors and policy makers is inflation is heading in the right direction, giving the Fed some leeway as they consider what to do at their next meeting.
Looking ahead to the second half
We think that economic growth will slow as consumers end their spending splurge—though that has not yet happened. The economy grew 2.0% and 2.4% in Q1 and Q2, respectively. But most of that growth in Q2 came from services spending and business investment, particularly in the transportation sector, as the economy saw an uptick in aircraft deliveries. The trajectory for business investment does not appear strong enough to carry the economy in the next quarter. Given the historical behavior for inventories, business investment, and net exports, Q3 GDP could likely be flat to slightly negative.
If demand slows in the coming quarters, we should see inflation metrics fall even further. Investors should pay close attention to unpaid credit card balances for signs of any cracking within the consumer sector. Stubborn inflation is one reason credit card debt has spiked this past year. In Q1 of this year, credit card debt rose to a record $986 billion, roughly $60 billion higher than the previous peak in 2019. Amid rising balances, credit card rates were 20.86% in May, an all-time high since the data series began in 1972, putting additional pressures on consumers.
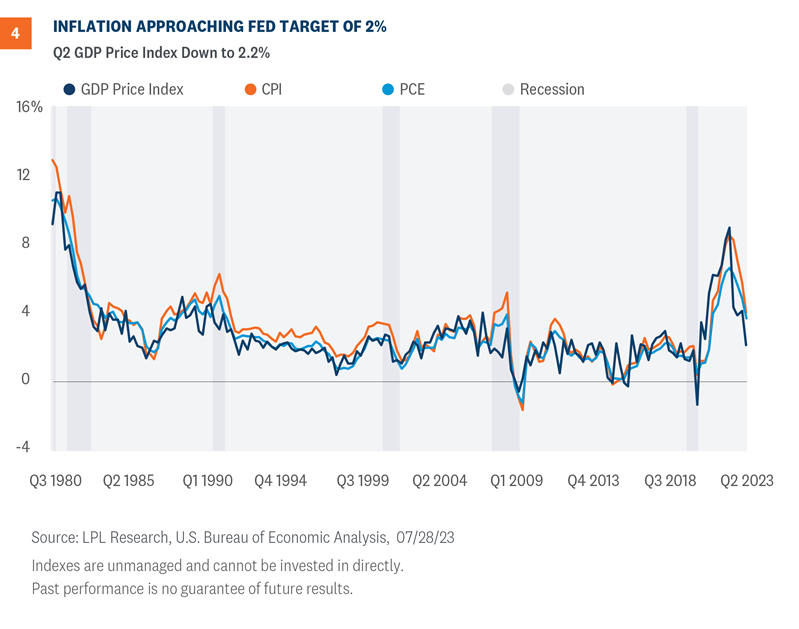
As the economy searches for stability, we think the inflation dynamic will continue to improve throughout the year as the economy slows and the Fed pauses. Despite some concern about the difficulty of achieving a 2% inflation target, inflation is approaching the Fed’s long-run target as shown in Figure 4. In Q2, the GDP price index fell to 2.2%, the lowest since the depths of the 2020 pandemic.
Investment conclusion
Stocks have added some to strong first half gains so far in July, pushing the S&P 500 over 4,500 and within 4% of a new all-time high. While this latest rally may have outpaced fundamentals and our fair value assessment in the short term, the U.S. economy and corporate America have remained resilient. The latest data, including GDP and inflation data reported last week, slightly raised the odds of a soft landing for the U.S. economy, though our base case still calls for a mild and short-lived recession to begin by year-end. A Fed pause is increasingly likely in September, supporting the case for staying fully invested.
LPL’s Strategic and Tactical Asset Allocation Committee (STAAC) recommends a neutral tactical allocation to equities, with a modest overweight to fixed income funded from cash. The risk-reward trade-off between stocks and bonds looks relatively balanced to us, with core bonds providing a yield advantage over cash. A Fed pause has historically been a positive for core bond investors.
The STAAC recommends being neutral on style, favors developed international equities over emerging markets and large caps over small, and maintains the industrials sector as its top overall sector pick.
Within fixed income, the STAAC recommends an up-in-quality approach with benchmark-level interest rate sensitivity. We think core bond sectors (U.S. Treasuries, agency mortgage-backed securities (MBS), and short-maturity investment grade corporates) are currently more attractive than plus sectors (high-yield bonds and non-U.S. sectors) with the exception of preferred securities, which look attractive after having sold off due to stresses in the banking system.
You may also be interested in:
- (Still) Waiting on the Fed to Be Done Raising Rates – July 24, 2023
- Earnings Need to Do Some Heavy Lifting to Keep Rally Going – July 17, 2023
- Capital Markets: The Essence of American Capitalism – July 3, 2023
IMPORTANT DISCLOSURES
This material is for general information only and is not intended to provide specific advice or recommendations for any individual. There is no assurance that the views or strategies discussed are suitable for all investors or will yield positive outcomes. Investing involves risks including possible loss of principal. Any economic forecasts set forth may not develop as predicted and are subject to change.
References to markets, asset classes, and sectors are generally regarding the corresponding market index. Indexes are unmanaged statistical composites and cannot be invested into directly. Index performance is not indicative of the performance of any investment and do not reflect fees, expenses, or sales charges. All performance referenced is historical and is no guarantee of future results.
Any company names noted herein are for educational purposes only and not an indication of trading intent or a solicitation of their products or services. LPL Financial doesn’t provide research on individual equities.
All information is believed to be from reliable sources; however, LPL Financial makes no representation as to its completeness or accuracy.
All investing involves risk, including possible loss of principal.
US Treasuries may be considered “safe haven” investments but do carry some degree of risk including interest rate, credit, and market risk. Bonds are subject to market and interest rate risk if sold prior to maturity. Bond values will decline as interest rates rise and bonds are subject to availability and change in price.
The Standard & Poor’s 500 Index (S&P500) is a capitalization-weighted index of 500 stocks designed to measure performance of the broad domestic economy through changes in the aggregate market value of 500 stocks representing all major industries.
The PE ratio (price-to-earnings ratio) is a measure of the price paid for a share relative to the annual net income or profit earned by the firm per share. It is a financial ratio used for valuation: a higher PE ratio means that investors are paying more for each unit of net income, so the stock is more expensive compared to one with lower PE ratio.
Earnings per share (EPS) is the portion of a company’s profit allocated to each outstanding share of common stock. EPS serves as an indicator of a company’s profitability. Earnings per share is generally considered to be the single most important variable in determining a share’s price. It is also a major component used to calculate the price-to-earnings valuation ratio.
All index data from Bloomberg.
For a list of descriptions of the indexes and economic terms referenced in this publication, please visit our website at lplresearch.com/definitions.
This research material has been prepared by LPL Financial LLC.
Securities and advisory services offered through LPL Financial (LPL), a registered investment advisor and broker -dealer (member FINRA/SIPC). Insurance products are offered through LPL or its licensed affiliates. To the extent you are receiving investment advice from a separately registered independent investment advisor that is not an LPL affiliate, please note LPL makes no representation with respect to such entity.
Not Insured by FDIC/NCUA or Any Other Government Agency | Not Bank/Credit Union Guaranteed | Not Bank/Credit Union Deposits or Obligations | May Lose Value |
RES-1580014-0623 | For Public Use | Tracking #1-05376467 (Exp. 07/24)
Related Insights

November 4, 2024
Election Stock Market Playbook
SharePrinter Friendly Version As Election Day approaches, we discuss potential stock market implications of various possible outcomes. But before we …
Read More navigate_next
October 28, 2024
What Scares Us About the Economy and Markets
SharePrinter Friendly Version Stocks have done so well this year that it’s fair to say market participants haven’t feared much. …
Read More navigate_next