(Still) Waiting on the Fed to Be Done Raising Rates
By Mueller Financial Services, July 24, 2023
The first half of the year probably didn’t go the way many fixed income investors had hoped, particularly after the historically awful year last year. It wasn’t a horrible start—more in line with recent years—but expectations were high this year, with many calling 2023 the year for fixed income. But the themes that negatively impacted fixed income investors last year have carried over into this year as well—namely inflation and the Federal Reserve (Fed). While many of us thought the Fed would likely be done raising rates at this point, given the still high (but falling) inflation levels, it looks like the Fed isn’t quite done just yet. Our base case is the Fed will raise rates again this week (and possibly one more time this year) but is close to the end of its rate hiking campaign. As we point out in our recent Midyear Outlook 2023: The Path Toward Stability, a Fed pause has been good news for fixed income. And since we know it’s not how you start but how you finish, once the Fed is done, it could mean the year for fixed income is only postponed and not canceled.
The (Head) Winds of Change
The Fed meets this week and is largely expected to raise short-term interest rates once again. With inflationary pressures trending in the right direction and still no signs of a wage/price spiral, which could reignite inflationary pressures, we think the Fed is just about done with its current rate hiking campaign.
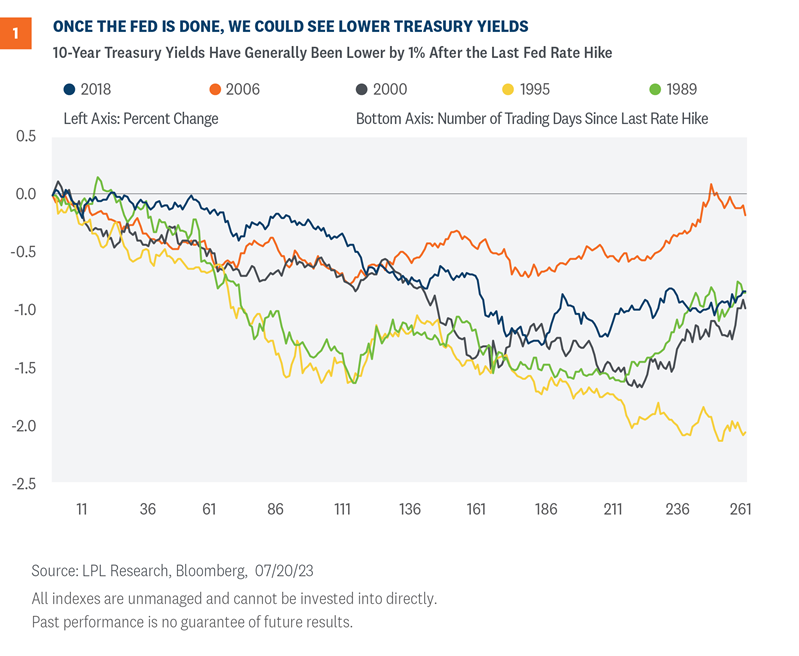
In fact, once the Fed is indeed done raising interest rates, we could start to see lower yields on intermediate-term securities before the Fed actually cuts rates. Just as the aggressive rate hiking cycle took Treasury yields higher, interest rate cuts will take Treasury (and other bond market) yields lower. Of the most recent Fed rate hiking campaigns (Figure 1), 10-year Treasury yields were lower, on average, by 1% a year after the Fed stopped raising rates. And while our base case remains a trading range for the 10-year yield between 3.25% and 3.75% throughout 2023 (similar to the 2006 Fed rate hiking campaign, when the Fed kept rates at elevated levels for over a year), we acknowledge there is a strong bias for yields to end the year lower than our expectations, which could mean strong positive returns for core bonds.
Now, we also acknowledge there is a risk that inflationary pressures remain high and that the Fed has to continue its rate hiking campaign into a weakening economy. As we mentioned in our Outlook 2023 Finding Balance, in that stagflationary scenario where the Fed takes the fed funds rate to 6%, we could see the 10-year around 4.75%. However, given where starting yields are, if interest rates increase by another 1% from current levels, fixed income markets broadly could all still generate slightly positive returns over the next 12 months.
Technical Trends Suggest the Highs are In
Treasury yields have been relatively volatile over the last several weeks as speculation intensifies over the Fed’s next monetary policy moves. Signs of labor market strength in the June ADP report drove rate hike expectations higher and two-year Treasury yields back to their March highs at 5.08% earlier this month. However, yields failed at this key resistance level after the nonfarm payrolls report showed that hiring decelerated in June. Technically, the message from the failed breakout and subsequent pullback in two-year yields suggests the Fed could be done raising rates after this week’s assumed 0.25% rate hike. Of course, the message from the market is subject to change, and if the Fed does lean more hawkish than expected, watch for resistance at 5.08%, as a breakout above this level would point to more rate hikes on the horizon.
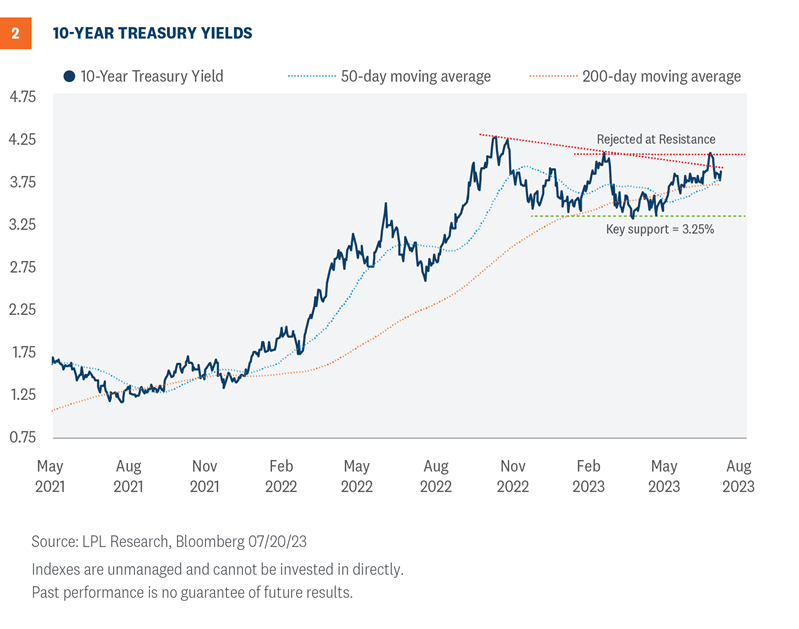
The technical setup for 10-year Treasury yields (Figure 2) suggests the high watermark for this rate hike cycle was set in October. Since then, a developing downtrend has emerged as yields registered a series of lower highs. While the jump in interest rates earlier this month briefly challenged this downtrend, resistance at the March highs contained the upside momentum. Yields have since pulled back and are now hovering above their 200-day moving average. (For reference, moving averages represent the average yield across a select number of trading days and are used to identify trend direction.) A break below support at the 200-day moving average near 3.70% would leave 3.25% as the next major area of downside support. This level not only marks the April lows for the 10-year, but it also traces back to the 2018 highs, a major breakout point from a multi-year bottom formation. Furthermore, support at 3.25% has prevented yields from registering consecutive lower lows, a major piece of missing evidence to confirm a new downtrend is officially underway. Given the significance of the 3.25% support level and what we view as limited upside risk for yields based on both technical and macro factors, we suspect 10-year yields will remain bound in the 3.25% to 3.75% range until a confirmed trend develops.
If History Rhymes…
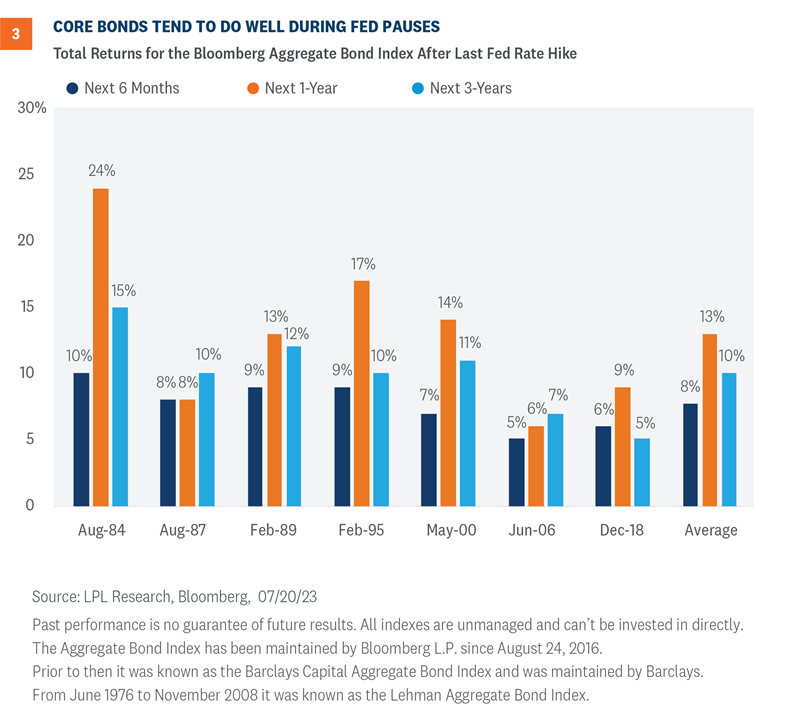
If history at least rhymes during this cycle and we do see lower yields over the next year, intermediate core bonds could very well outperform cash and other shorter maturity fixed income strategies. Historically, core bonds, as proxied by the Bloomberg Aggregate Bond Index, have performed well during Fed rate hike pauses (Figure 3). Since 1984, core bonds were able to generate average 6-month and 1-year returns of 8% and 13% (annualized), respectively, after the Fed stopped raising rates. Moreover, all periods generated positive returns over the 6-month, 1-year, and 3-year horizons.
But, even if rates don’t fall from current levels, fixed income is as attractive as it has been in over a decade. There are three primary reasons to own fixed income: diversification, liquidity, and income. Right now, investors can build a high-quality fixed income portfolio of U.S. Treasury securities, AAA-rated Agency mortgage-backed securities (MBS), and short maturity investment grade corporates that can yield 5-6% and will do well if rates fall and provide steady income if rates stay at current levels. Moreover, until rates do eventually fall, you get paid to hold fixed income from the coupon payment. And, the longer rates stay at these elevated levels, the more enduring fixed income is as an asset class, which is good news for income-oriented investors. Investors don’t have to “reach for yield” anymore and take on a lot of risk to meet their income needs.
Conclusion
LPL’s Strategic and Tactical Asset Allocation Committee (STAAC) recommends a neutral tactical allocation to equities, with a modest overweight to fixed income funded from cash. The risk-reward trade-off between stocks and bonds looks relatively balanced to us, with core bonds providing a yield advantage over cash. A Fed pause has historically been a positive for core bond investors.
The STAAC recommends being neutral on style, favors developed international equities over emerging markets and large caps over small, and maintains the industrials sector as its top overall sector pick.
Within fixed income, the STAAC recommends an up-in-quality approach with benchmark-level interest rate sensitivity. We think core bond sectors (U.S. Treasuries, agency mortgage-backed securities (MBS), and short-maturity investment grade corporates) are currently more attractive than plus sectors (high-yield bonds and non-U.S. sectors) with the exception of preferred securities, which look attractive after having sold off due to stresses in the banking system.
Further, we’ve maintained a neutral duration relative to our benchmark (the Bloomberg Aggregate Index) with the expectation that Treasury yields are likely headed lower (or at least not much higher) over the next few quarters. And if yields fall from current levels, investors will have likely missed an opportunity to invest in yields we’ve not seen in over a decade.
So, unless investors have short-term income needs, they may be better served by reducing some of their excess cash holdings and by extending the maturity profile of their fixed income portfolio to lock in these higher yields for longer. Bond funds and ETFs that track the Bloomberg Aggregate Index, along with separately managed accounts and laddered portfolios, all represent attractive options that will allow investors to take advantage of these higher rates before they’re gone.
Lawrence Gillum, CFA, Chief Fixed Income Strategist, LPL Financial
Adam Turnquist, CMT, Chief Technical Strategist, LPL Financial
You may also be interested in:
- Earnings Need to Do Some Heavy Lifting to Keep Rally Going – July 17, 2023
- Capital Markets: The Essence of American Capitalism – July 3, 2023
- The New Standard and Poor’s 500 Bull Needs a Breather – June 26, 2023
IMPORTANT DISCLOSURES
This material is for general information only and is not intended to provide specific advice or recommendations for any individual. There is no assurance that the views or strategies discussed are suitable for all investors or will yield positive outcomes. Investing involves risks including possible loss of principal. Any economic forecasts set forth may not develop as predicted and are subject to change.
References to markets, asset classes, and sectors are generally regarding the corresponding market index. Indexes are unmanaged statistical composites and cannot be invested into directly. Index performance is not indicative of the performance of any investment and do not reflect fees, expenses, or sales charges. All performance referenced is historical and is no guarantee of future results.
Any company names noted herein are for educational purposes only and not an indication of trading intent or a solicitation of their products or services. LPL Financial doesn’t provide research on individual equities.
All information is believed to be from reliable sources; however, LPL Financial makes no representation as to its completeness or accuracy.
All investing involves risk, including possible loss of principal.
US Treasuries may be considered “safe haven” investments but do carry some degree of risk including interest rate, credit, and market risk. Bonds are subject to market and interest rate risk if sold prior to maturity. Bond values will decline as interest rates rise and bonds are subject to availability and change in price.
The Standard & Poor’s 500 Index (S&P500) is a capitalization-weighted index of 500 stocks designed to measure performance of the broad domestic economy through changes in the aggregate market value of 500 stocks representing all major industries.
The PE ratio (price-to-earnings ratio) is a measure of the price paid for a share relative to the annual net income or profit earned by the firm per share. It is a financial ratio used for valuation: a higher PE ratio means that investors are paying more for each unit of net income, so the stock is more expensive compared to one with lower PE ratio.
Earnings per share (EPS) is the portion of a company’s profit allocated to each outstanding share of common stock. EPS serves as an indicator of a company’s profitability. Earnings per share is generally considered to be the single most important variable in determining a share’s price. It is also a major component used to calculate the price-to-earnings valuation ratio.
All index data from Bloomberg.
For a list of descriptions of the indexes and economic terms referenced in this publication, please visit our website at lplresearch.com/definitions.
This research material has been prepared by LPL Financial LLC.
Securities and advisory services offered through LPL Financial (LPL), a registered investment advisor and broker -dealer (member FINRA/SIPC). Insurance products are offered through LPL or its licensed affiliates. To the extent you are receiving investment advice from a separately registered independent investment advisor that is not an LPL affiliate, please note LPL makes no representation with respect to such entity.
Not Insured by FDIC/NCUA or Any Other Government Agency | Not Bank/Credit Union Guaranteed | Not Bank/Credit Union Deposits or Obligations | May Lose Value |
RES-1580014-0623 | For Public Use | Tracking #1-05375923 (Exp. 07/24)
Related Insights

November 4, 2024
Election Stock Market Playbook
SharePrinter Friendly Version As Election Day approaches, we discuss potential stock market implications of various possible outcomes. But before we …
Read More navigate_next
October 28, 2024
What Scares Us About the Economy and Markets
SharePrinter Friendly Version Stocks have done so well this year that it’s fair to say market participants haven’t feared much. …
Read More navigate_next